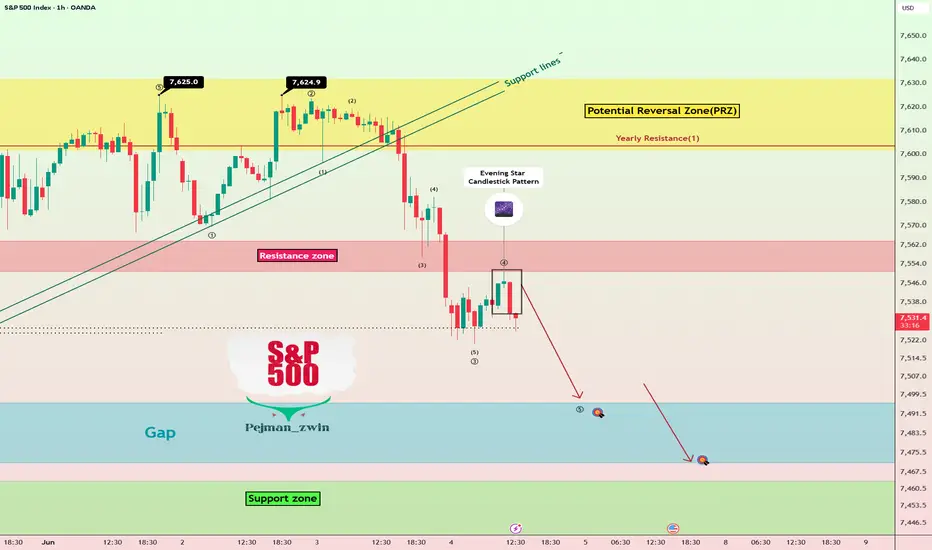
As I expected in the previous idea, the S&P 500( SPX500) started its decline from the Potential Reversal Zone(PRZ)[$7,632-$7,602] and marked its all-time highs right in that PRZ. After breaking significant support lines, the index began to drop—one key reason for this decline could be the escalating tensions in the Middle East.
Currently, the S&P 500 has broken a support zone($7,564-$7,551) and seems to have completed a pullback to that zone, forming an evening star candlestick pattern. We could expect further downside.
From an Elliott Wave theory standpoint, it appears that the S&P 500 is completing either its major wave 3 or wave 5.
I expect the S&P 500 to decline further once U.S. markets open, aiming to fill the lower Gap($7,496.20-$7,471.40).
First Target: $7,504
Second Target: $7,476
Stop Loss(SL): $7,573
Note: A sharp drop in the S&P 500 could also impact correlated markets like cryptocurrencies, especially Bitcoin(
 BTCUSDT).
What’s your view on the S&P 500? Will it continue its decline, or could we see a new all-time high again?
💡 Please respect each other's opinions and express agreement or disagreement politely.
📌 S&P 500 Index Analyze (SPX500USD), 1-hour time frame.
🛑 Always set a Stop Loss(SL) for every position you open.
✅ This is just my idea; I’d love to see your thoughts too!
🔥 If you find it helpful, please BOOST this post and share it with your friends.
SPX500) started its decline from the Potential Reversal Zone(PRZ)[$7,632-$7,602] and marked its all-time highs right in that PRZ. After breaking significant support lines, the index began to drop—one key reason for this decline could be the escalating tensions in the Middle East.Currently, the S&P 500 has broken a support zone($7,564-$7,551) and seems to have completed a pullback to that zone, forming an evening star candlestick pattern. We could expect further downside.
From an Elliott Wave theory standpoint, it appears that the S&P 500 is completing either its major wave 3 or wave 5.
I expect the S&P 500 to decline further once U.S. markets open, aiming to fill the lower Gap($7,496.20-$7,471.40).
First Target: $7,504
Second Target: $7,476
Stop Loss(SL): $7,573
Note: A sharp drop in the S&P 500 could also impact correlated markets like cryptocurrencies, especially Bitcoin(
BTCUSDT).What’s your view on the S&P 500? Will it continue its decline, or could we see a new all-time high again?
💡 Please respect each other's opinions and express agreement or disagreement politely.
📌 S&P 500 Index Analyze (SPX500USD), 1-hour time frame.
🛑 Always set a Stop Loss(SL) for every position you open.
✅ This is just my idea; I’d love to see your thoughts too!
🔥 If you find it helpful, please BOOST this post and share it with your friends.
Zlecenie aktywne
Transakcja zakończona: osiągnięto poziom stop
Stop Loss was touched, but I opened another one near the PRZ, and TP touched.Risk-To-Reward(RR) is important.

🚀 Up to 75% Trading Fee Rebates Across 20+ Exchanges:
🤖 t.me/Protrader365bot
-----
🎁 Free VIP Forex and Crypto Signals, please visit:
🔗 t.me/ProTrader_365
🤖 t.me/Protrader365bot
-----
🎁 Free VIP Forex and Crypto Signals, please visit:
🔗 t.me/ProTrader_365
Powiązane publikacje
Wyłączenie odpowiedzialności
Informacje i publikacje nie stanowią i nie powinny być traktowane jako porady finansowe, inwestycyjne, tradingowe ani jakiekolwiek inne rekomendacje dostarczane lub zatwierdzone przez TradingView. Więcej informacji znajduje się w Warunkach użytkowania.
🚀 Up to 75% Trading Fee Rebates Across 20+ Exchanges:
🤖 t.me/Protrader365bot
-----
🎁 Free VIP Forex and Crypto Signals, please visit:
🔗 t.me/ProTrader_365
🤖 t.me/Protrader365bot
-----
🎁 Free VIP Forex and Crypto Signals, please visit:
🔗 t.me/ProTrader_365
Powiązane publikacje
Wyłączenie odpowiedzialności
Informacje i publikacje nie stanowią i nie powinny być traktowane jako porady finansowe, inwestycyjne, tradingowe ani jakiekolwiek inne rekomendacje dostarczane lub zatwierdzone przez TradingView. Więcej informacji znajduje się w Warunkach użytkowania.