
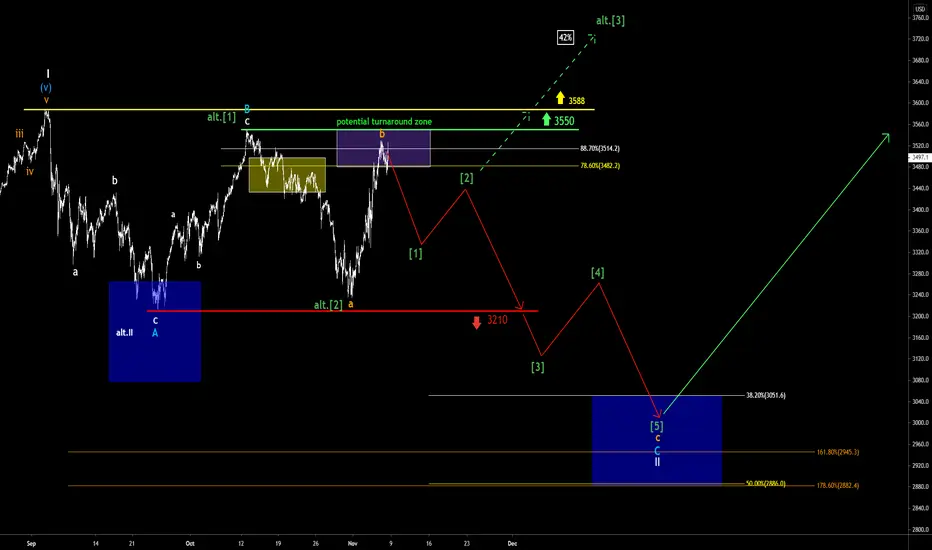
Due to the bullish action, we had to update our chart. We put a bullish alternative on the chart. At the moment, the bears are still in charge of the chart, and we see them aiming at the 3000 point mark. However, our alternative scenario depicted by alt. and the dashed arrows must be taken into account with a high percentage of 42%. Price action is in a crucial area right now. If the bulls manage to break above the Resistance at 3550, the SP500 could be on the breakout to 3800 and higher. Our primary expectation under the mentioned 3550 remains a further decline to about 3000. For further confirmation, we need some bearish action and prices to drop at least under the 3460 mark.

📊 Daily market insights combining macro + Elliott Wave analysis
🚀 Spot trends early with momentum, sentiment & price structure
🌐 Join thousands trading smarter at hkcmglobal.com
🚀 Spot trends early with momentum, sentiment & price structure
🌐 Join thousands trading smarter at hkcmglobal.com
Powiązane publikacje
Wyłączenie odpowiedzialności
Informacje i publikacje nie stanowią i nie powinny być traktowane jako porady finansowe, inwestycyjne, tradingowe ani jakiekolwiek inne rekomendacje dostarczane lub zatwierdzone przez TradingView. Więcej informacji znajduje się w Warunkach użytkowania.
📊 Daily market insights combining macro + Elliott Wave analysis
🚀 Spot trends early with momentum, sentiment & price structure
🌐 Join thousands trading smarter at hkcmglobal.com
🚀 Spot trends early with momentum, sentiment & price structure
🌐 Join thousands trading smarter at hkcmglobal.com
Powiązane publikacje
Wyłączenie odpowiedzialności
Informacje i publikacje nie stanowią i nie powinny być traktowane jako porady finansowe, inwestycyjne, tradingowe ani jakiekolwiek inne rekomendacje dostarczane lub zatwierdzone przez TradingView. Więcej informacji znajduje się w Warunkach użytkowania.