
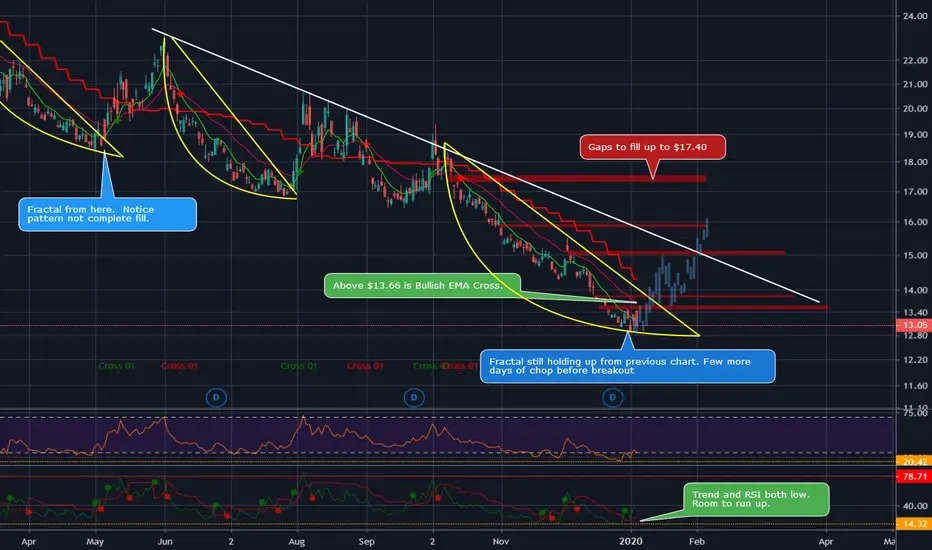
Trading active in SPXS. Entry at $13.10 or less is great entry for 1 month hold max.
Trade Entry
I recommend using Dollar Cost Averaging to scatter orders under the $13.10 mark.
Chart Details
SPXS fractal holding from previous chart.
Fractal shows we will have few days chop sideways before pattern breakout.
Last fractal did not fill pattern, so I expect we do not get down into the $12.75 area.
Many gaps to fill going up to $17.
Price break of 13.66 confirms EMA bullish cross.
Price break of $14.31 confirms SPY should start pullback/correction.
About Me
Thank you for liking, commenting, throwing up a chart, following, or viewing.
I am not a financial advisor. My comments and reviews are based on what I do with my personal accounts.
Website will be ready for launch mid-January 2020. Thank you for your patience while I try to juggle everything and maintain the same standards.
Disclosure - I am long BTCUSD, GBTC. Short term GDX Bullish, SPXS Bullish, CRWD Bullish short term.
Previous SPXS Chart

Trade Entry
I recommend using Dollar Cost Averaging to scatter orders under the $13.10 mark.
Chart Details
SPXS fractal holding from previous chart.
Fractal shows we will have few days chop sideways before pattern breakout.
Last fractal did not fill pattern, so I expect we do not get down into the $12.75 area.
Many gaps to fill going up to $17.
Price break of 13.66 confirms EMA bullish cross.
Price break of $14.31 confirms SPY should start pullback/correction.
About Me
Thank you for liking, commenting, throwing up a chart, following, or viewing.
I am not a financial advisor. My comments and reviews are based on what I do with my personal accounts.
Website will be ready for launch mid-January 2020. Thank you for your patience while I try to juggle everything and maintain the same standards.
Disclosure - I am long BTCUSD, GBTC. Short term GDX Bullish, SPXS Bullish, CRWD Bullish short term.
Previous SPXS Chart

Wyłączenie odpowiedzialności
Informacje i publikacje nie stanowią i nie powinny być traktowane jako porady finansowe, inwestycyjne, tradingowe ani jakiekolwiek inne rekomendacje dostarczane lub zatwierdzone przez TradingView. Więcej informacji znajduje się w Warunkach użytkowania.
Wyłączenie odpowiedzialności
Informacje i publikacje nie stanowią i nie powinny być traktowane jako porady finansowe, inwestycyjne, tradingowe ani jakiekolwiek inne rekomendacje dostarczane lub zatwierdzone przez TradingView. Więcej informacji znajduje się w Warunkach użytkowania.