
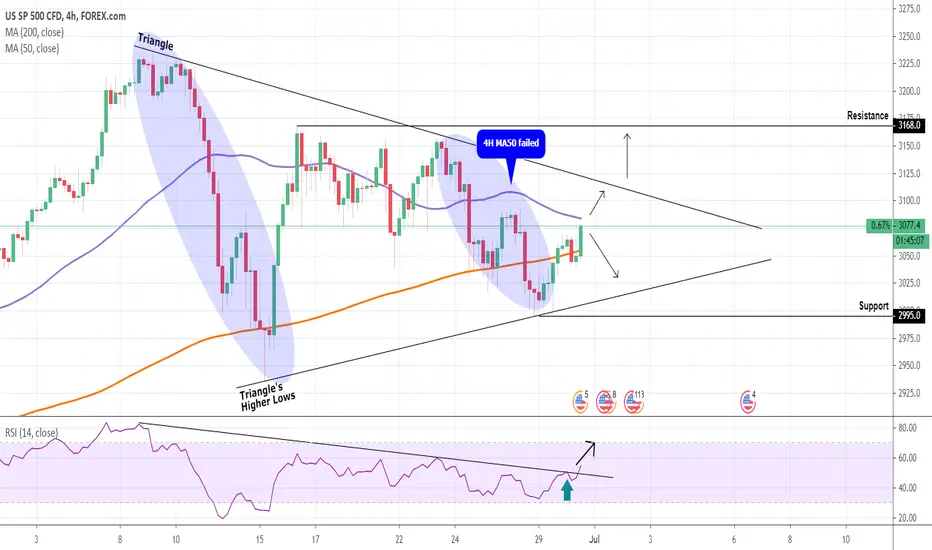
S&P500 is trading within a Triangle on the 4H chart (RSI = 53.651, MACD = -10.000, ADX = 26.709). The price is now testing the 4H MA50 and if broken we expect it to reach the Lower High trend-line. The RSI broke above a 20 day bearish trend-line so we are expecting a break above the Triangle towards the 3,168 Resistance.
** If you like our free content follow our profile to get more daily ideas. **
Comments and likes are greatly appreciated.
** If you like our free content follow our profile to get more daily ideas. **
Comments and likes are greatly appreciated.

I trade Crypto, Forex, Indices & Commodities all from one account on PrimeXBT with TradingView charts
Register here👉 investingscope.s.gy/PrimeXBT
Contact me for Account Management (+15% monthly profit)
Telegram👉 t.me/investingscope
Register here👉 investingscope.s.gy/PrimeXBT
Contact me for Account Management (+15% monthly profit)
Telegram👉 t.me/investingscope
Wyłączenie odpowiedzialności
Informacje i publikacje nie stanowią i nie powinny być traktowane jako porady finansowe, inwestycyjne, tradingowe ani jakiekolwiek inne rekomendacje dostarczane lub zatwierdzone przez TradingView. Więcej informacji znajduje się w Warunkach użytkowania.
I trade Crypto, Forex, Indices & Commodities all from one account on PrimeXBT with TradingView charts
Register here👉 investingscope.s.gy/PrimeXBT
Contact me for Account Management (+15% monthly profit)
Telegram👉 t.me/investingscope
Register here👉 investingscope.s.gy/PrimeXBT
Contact me for Account Management (+15% monthly profit)
Telegram👉 t.me/investingscope
Wyłączenie odpowiedzialności
Informacje i publikacje nie stanowią i nie powinny być traktowane jako porady finansowe, inwestycyjne, tradingowe ani jakiekolwiek inne rekomendacje dostarczane lub zatwierdzone przez TradingView. Więcej informacji znajduje się w Warunkach użytkowania.