
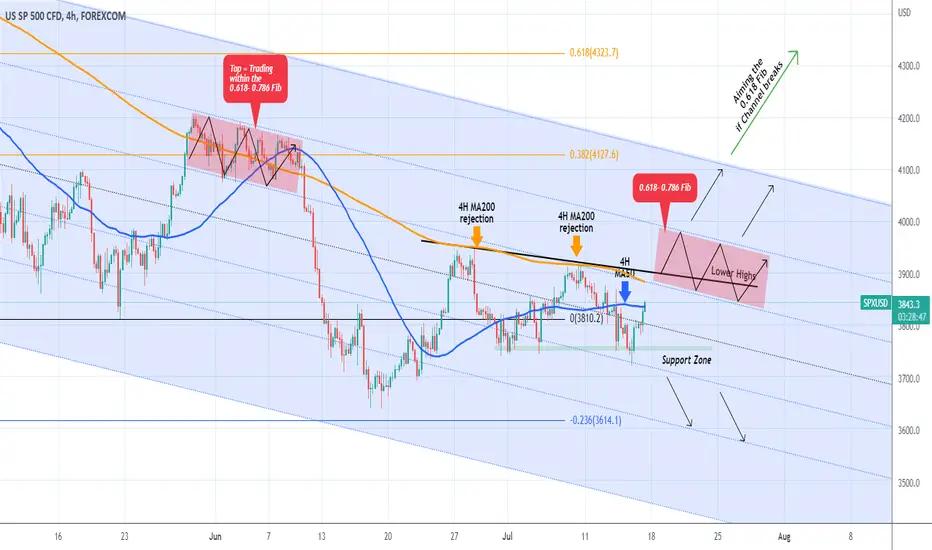
The S&P500 index has been trading mostly sideways since the June 27 High. The pattern that stands out during that time is a Triangle, with the price keeping (and rebounding since yesterday on) the 3750 Support intact (closed all 4H candles above it). The top of the Triangle involves a Lower Highs trend-line, approximately on the same path of the 4H MA200 (orange trend-line) that already has two clear rejections on the patterns Lower Highs.
At the moment the price is testing the 4H MA50 (blue trend-line) and naturally if broken a 4H MA200 test should follow. There are many Resistance levels up ahead, even if we close above the 4H MA200, we need to consider the Resistance strength of the 0.618-0.786 Fibonacci zones of the Channel Down (remember it is the dominant pattern throughout the whole year when the correction started).
The short-term strategy is to take one Resistance at a time and target the higher levels only if we get a clear 4H candle closing above the current Resistance at hand. In the same notion, a break above the Channel Down, which is approximately where the 0.382 Fib is, targets the 0.618 level at around 4320. Similarly a closing below the 3750 Support, targets the 0.236 Fibonacci level.
--------------------------------------------------------------------------------------------------------
Please like, subscribe and share your ideas and charts with the community!
--------------------------------------------------------------------------------------------------------
At the moment the price is testing the 4H MA50 (blue trend-line) and naturally if broken a 4H MA200 test should follow. There are many Resistance levels up ahead, even if we close above the 4H MA200, we need to consider the Resistance strength of the 0.618-0.786 Fibonacci zones of the Channel Down (remember it is the dominant pattern throughout the whole year when the correction started).
The short-term strategy is to take one Resistance at a time and target the higher levels only if we get a clear 4H candle closing above the current Resistance at hand. In the same notion, a break above the Channel Down, which is approximately where the 0.382 Fib is, targets the 0.618 level at around 4320. Similarly a closing below the 3750 Support, targets the 0.236 Fibonacci level.
--------------------------------------------------------------------------------------------------------
Please like, subscribe and share your ideas and charts with the community!
--------------------------------------------------------------------------------------------------------

I trade Crypto, Forex, Indices & Commodities on PrimeXBT — all from one account with TradingView charts 👉 tradingshot.short.gy/PrimeXBT
I also use TradeNation for fixed spreads & zero commission 👉 tradingshot.short.gy/Tradenation
I also use TradeNation for fixed spreads & zero commission 👉 tradingshot.short.gy/Tradenation
Wyłączenie odpowiedzialności
Informacje i publikacje nie stanowią i nie powinny być traktowane jako porady finansowe, inwestycyjne, tradingowe ani jakiekolwiek inne rekomendacje dostarczane lub zatwierdzone przez TradingView. Więcej informacji znajduje się w Warunkach użytkowania.
I trade Crypto, Forex, Indices & Commodities on PrimeXBT — all from one account with TradingView charts 👉 tradingshot.short.gy/PrimeXBT
I also use TradeNation for fixed spreads & zero commission 👉 tradingshot.short.gy/Tradenation
I also use TradeNation for fixed spreads & zero commission 👉 tradingshot.short.gy/Tradenation
Wyłączenie odpowiedzialności
Informacje i publikacje nie stanowią i nie powinny być traktowane jako porady finansowe, inwestycyjne, tradingowe ani jakiekolwiek inne rekomendacje dostarczane lub zatwierdzone przez TradingView. Więcej informacji znajduje się w Warunkach użytkowania.