
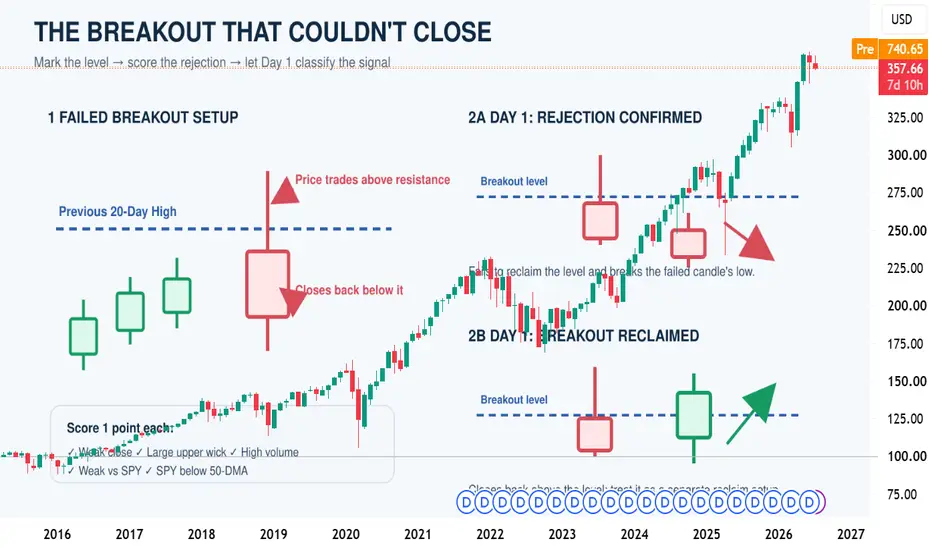
A Simple Five-Point Framework for Studying Failed Breakouts
Not every move above resistance becomes a successful breakout.
Sometimes, price trades above an important level during the session but fails to hold it and closes back below. This may indicate that buyers were unable to maintain control.
However, one failed candle is not enough. We need a consistent method to separate meaningful rejection from ordinary market noise.
𝗜𝗗𝗘𝗡𝗧𝗜𝗙𝗬𝗜𝗡𝗚 𝗧𝗛𝗘 𝗦𝗘𝗧𝗨𝗣
First, mark the highest price reached during the previous 20 completed daily candles.
A failed-breakout candidate appears when:
• Today’s high moves above the previous 20-day high.
• Today’s close finishes back below that level.
Do not include the current candle when calculating the previous 20-day high. Always wait for the daily candle to close before evaluating the setup.
𝗧𝗛𝗘 𝗙𝗜𝗩𝗘-𝗣𝗢𝗜𝗡𝗧 𝗖𝗛𝗘𝗖𝗞
Give the setup one point for each condition.
𝟭. 𝗪𝗲𝗮𝗸 𝗖𝗹𝗼𝘀𝗶𝗻𝗴 𝗣𝗼𝘀𝗶𝘁𝗶𝗼𝗻
The candle closes in the lower half of its daily range. This suggests that sellers gained control before the session ended.
𝟮. 𝗟𝗮𝗿𝗴𝗲 𝗨𝗽𝗽𝗲𝗿 𝗪𝗶𝗰𝗸
The upper wick is at least one-third of the candle’s total range. It shows that price reached higher levels but could not remain there.
𝟯. 𝗛𝗶𝗴𝗵 𝗩𝗼𝗹𝘂𝗺𝗲
The day’s volume is at least 1.5 times the average volume of the previous 20 sessions.
Higher volume makes the rejection more meaningful because more market participation was involved.
𝟰. 𝗪𝗲𝗮𝗸𝗻𝗲𝘀𝘀 𝗥𝗲𝗹𝗮𝘁𝗶𝘃𝗲 𝘁𝗼 𝗦𝗣𝗬
The stock’s 20-day return is lower than SPY’s return over the same period.
A stock already underperforming the broader market may have less support behind its breakout attempt.
𝟱. 𝗪𝗲𝗮𝗸 𝗠𝗮𝗿𝗸𝗲𝘁 𝗘𝗻𝘃𝗶𝗿𝗼𝗻𝗺𝗲𝗻𝘁
SPY is trading below its 50-day moving average.
A failed breakout may carry more weight when the overall market environment is weak.
𝗛𝗢𝗪 𝗧𝗢 𝗥𝗘𝗔𝗗 𝗧𝗛𝗘 𝗦𝗖𝗢𝗥𝗘
🔴 0–1 points: Weak evidence. It may simply be market noise.
🟡 2–3 points: Mixed evidence. Wait for more information.
🟢 4–5 points: Strong rejection candidate. Observe the next completed daily candle.
The score is not a prediction or an automatic trade signal. Its purpose is to organize the available evidence consistently.
𝗔𝗣𝗣𝗟𝗬𝗜𝗡𝗚 𝗧𝗛𝗘 𝗙𝗥𝗔𝗠𝗘𝗪𝗢𝗥𝗞 𝗢𝗡 𝗧𝗥𝗔𝗗𝗜𝗡𝗚𝗩𝗜𝗘𝗪
1. Open the stock’s chart.
2. Select the 1D timeframe and Candles chart type.
3. Add the Volume indicator.
4. Add a 50-period Simple Moving Average.
5. Add SPY through “Compare or Add Symbol.”
6. Examine the previous 20 completed daily candles.
7. Mark their highest high with a horizontal line.
8. Wait for the current daily candle to close.
9. Check the five conditions and record the score.
𝗖𝗛𝗔𝗥𝗧 𝗟𝗔𝗕𝗘𝗟𝗦
🔵 Blue line: Previous 20-day high
🔴 Red marker: Failed-breakout candidate
⚠️ Yellow marker: Unresolved outcome
✅ Green marker: Confirmed outcome
𝗪𝗛𝗔𝗧 𝗛𝗔𝗣𝗣𝗘𝗡𝗦 𝗢𝗡 𝗗𝗔𝗬 𝟭?
🔴 𝗥𝗘𝗝𝗘𝗖𝗧𝗜𝗢𝗡 𝗖𝗢𝗡𝗙𝗜𝗥𝗠𝗘𝗗
The rejection is confirmed when Day 1:
• Fails to close back above the breakout level.
• Closes below the low of the failed-breakout candle.
Both conditions should be satisfied before classifying the setup as a confirmed rejection.
🟢 𝗕𝗥𝗘𝗔𝗞𝗢𝗨𝗧 𝗥𝗘𝗖𝗟𝗔𝗜𝗠𝗘𝗗
The breakout is reclaimed when Day 1:
• Closes back above the breakout level.
• Closes in the upper half of its daily range.
A reclaim should be recorded as a separate setup instead of being treated as a confirmed failed breakout.
⚠️ 𝗨𝗡𝗥𝗘𝗦𝗢𝗟𝗩𝗘𝗗
If neither classification is satisfied, mark the setup as unresolved.
Do not force every chart into a bullish or bearish conclusion. Sometimes the correct decision is to wait for more information.
𝗧𝗘𝗦𝗧𝗜𝗡𝗚 𝗧𝗛𝗘 𝗙𝗥𝗔𝗠𝗘𝗪𝗢𝗥𝗞 𝗪𝗜𝗧𝗛 𝗕𝗔𝗥 𝗥𝗘𝗣𝗟𝗔𝗬
Before drawing conclusions, test the framework on historical data.
1. Open TradingView’s Bar Replay.
2. Select an earlier date.
3. Move forward one daily candle at a time.
4. Keep future candles hidden.
5. Record the Day 0 score.
6. Record the Day 1 classification.
7. Measure the return after one, three and five sessions.
8. Repeat the process for at least 50 historical examples.
𝗦𝗜𝗠𝗣𝗟𝗘 𝗥𝗘𝗖𝗢𝗥𝗗 𝗙𝗢𝗥𝗠𝗔𝗧
Date: May 10
Symbol: XYZ
Five-Point Score: 4
Day 1 Result: Rejection Confirmed
Day 3 Return: −2.1%
Day 5 Return: −3.4%
𝗔𝗩𝗢𝗜𝗗 𝗦𝗘𝗟𝗘𝗖𝗧𝗜𝗢𝗡 𝗕𝗜𝗔𝗦
Do not select only famous or obvious failed breakouts.
Use a fixed list of stocks and a fixed historical period. Record every setup that meets the original definition, including weak and unresolved examples.
The framework becomes interesting only if high-scoring setups produce consistently different results from low-scoring setups.
𝗙𝗜𝗡𝗔𝗟 𝗣𝗥𝗢𝗖𝗘𝗦𝗦
Mark the level → Wait for the close → Calculate the score → Classify Day 1 → Record the results
A useful market framework should not depend on one attractive chart. It should use clear definitions, repeatable rules and enough historical observations to show whether the idea deserves further research.
𝗗𝗜𝗦𝗖𝗟𝗔𝗜𝗠𝗘𝗥
This material is provided for educational and research purposes only. It is not financial advice or a guaranteed trading strategy. Test the framework with Bar Replay or paper trading before considering any real-money decision.
Not every move above resistance becomes a successful breakout.
Sometimes, price trades above an important level during the session but fails to hold it and closes back below. This may indicate that buyers were unable to maintain control.
However, one failed candle is not enough. We need a consistent method to separate meaningful rejection from ordinary market noise.
𝗜𝗗𝗘𝗡𝗧𝗜𝗙𝗬𝗜𝗡𝗚 𝗧𝗛𝗘 𝗦𝗘𝗧𝗨𝗣
First, mark the highest price reached during the previous 20 completed daily candles.
A failed-breakout candidate appears when:
• Today’s high moves above the previous 20-day high.
• Today’s close finishes back below that level.
Do not include the current candle when calculating the previous 20-day high. Always wait for the daily candle to close before evaluating the setup.
𝗧𝗛𝗘 𝗙𝗜𝗩𝗘-𝗣𝗢𝗜𝗡𝗧 𝗖𝗛𝗘𝗖𝗞
Give the setup one point for each condition.
𝟭. 𝗪𝗲𝗮𝗸 𝗖𝗹𝗼𝘀𝗶𝗻𝗴 𝗣𝗼𝘀𝗶𝘁𝗶𝗼𝗻
The candle closes in the lower half of its daily range. This suggests that sellers gained control before the session ended.
𝟮. 𝗟𝗮𝗿𝗴𝗲 𝗨𝗽𝗽𝗲𝗿 𝗪𝗶𝗰𝗸
The upper wick is at least one-third of the candle’s total range. It shows that price reached higher levels but could not remain there.
𝟯. 𝗛𝗶𝗴𝗵 𝗩𝗼𝗹𝘂𝗺𝗲
The day’s volume is at least 1.5 times the average volume of the previous 20 sessions.
Higher volume makes the rejection more meaningful because more market participation was involved.
𝟰. 𝗪𝗲𝗮𝗸𝗻𝗲𝘀𝘀 𝗥𝗲𝗹𝗮𝘁𝗶𝘃𝗲 𝘁𝗼 𝗦𝗣𝗬
The stock’s 20-day return is lower than SPY’s return over the same period.
A stock already underperforming the broader market may have less support behind its breakout attempt.
𝟱. 𝗪𝗲𝗮𝗸 𝗠𝗮𝗿𝗸𝗲𝘁 𝗘𝗻𝘃𝗶𝗿𝗼𝗻𝗺𝗲𝗻𝘁
SPY is trading below its 50-day moving average.
A failed breakout may carry more weight when the overall market environment is weak.
𝗛𝗢𝗪 𝗧𝗢 𝗥𝗘𝗔𝗗 𝗧𝗛𝗘 𝗦𝗖𝗢𝗥𝗘
🔴 0–1 points: Weak evidence. It may simply be market noise.
🟡 2–3 points: Mixed evidence. Wait for more information.
🟢 4–5 points: Strong rejection candidate. Observe the next completed daily candle.
The score is not a prediction or an automatic trade signal. Its purpose is to organize the available evidence consistently.
𝗔𝗣𝗣𝗟𝗬𝗜𝗡𝗚 𝗧𝗛𝗘 𝗙𝗥𝗔𝗠𝗘𝗪𝗢𝗥𝗞 𝗢𝗡 𝗧𝗥𝗔𝗗𝗜𝗡𝗚𝗩𝗜𝗘𝗪
1. Open the stock’s chart.
2. Select the 1D timeframe and Candles chart type.
3. Add the Volume indicator.
4. Add a 50-period Simple Moving Average.
5. Add SPY through “Compare or Add Symbol.”
6. Examine the previous 20 completed daily candles.
7. Mark their highest high with a horizontal line.
8. Wait for the current daily candle to close.
9. Check the five conditions and record the score.
𝗖𝗛𝗔𝗥𝗧 𝗟𝗔𝗕𝗘𝗟𝗦
🔵 Blue line: Previous 20-day high
🔴 Red marker: Failed-breakout candidate
⚠️ Yellow marker: Unresolved outcome
✅ Green marker: Confirmed outcome
𝗪𝗛𝗔𝗧 𝗛𝗔𝗣𝗣𝗘𝗡𝗦 𝗢𝗡 𝗗𝗔𝗬 𝟭?
🔴 𝗥𝗘𝗝𝗘𝗖𝗧𝗜𝗢𝗡 𝗖𝗢𝗡𝗙𝗜𝗥𝗠𝗘𝗗
The rejection is confirmed when Day 1:
• Fails to close back above the breakout level.
• Closes below the low of the failed-breakout candle.
Both conditions should be satisfied before classifying the setup as a confirmed rejection.
🟢 𝗕𝗥𝗘𝗔𝗞𝗢𝗨𝗧 𝗥𝗘𝗖𝗟𝗔𝗜𝗠𝗘𝗗
The breakout is reclaimed when Day 1:
• Closes back above the breakout level.
• Closes in the upper half of its daily range.
A reclaim should be recorded as a separate setup instead of being treated as a confirmed failed breakout.
⚠️ 𝗨𝗡𝗥𝗘𝗦𝗢𝗟𝗩𝗘𝗗
If neither classification is satisfied, mark the setup as unresolved.
Do not force every chart into a bullish or bearish conclusion. Sometimes the correct decision is to wait for more information.
𝗧𝗘𝗦𝗧𝗜𝗡𝗚 𝗧𝗛𝗘 𝗙𝗥𝗔𝗠𝗘𝗪𝗢𝗥𝗞 𝗪𝗜𝗧𝗛 𝗕𝗔𝗥 𝗥𝗘𝗣𝗟𝗔𝗬
Before drawing conclusions, test the framework on historical data.
1. Open TradingView’s Bar Replay.
2. Select an earlier date.
3. Move forward one daily candle at a time.
4. Keep future candles hidden.
5. Record the Day 0 score.
6. Record the Day 1 classification.
7. Measure the return after one, three and five sessions.
8. Repeat the process for at least 50 historical examples.
𝗦𝗜𝗠𝗣𝗟𝗘 𝗥𝗘𝗖𝗢𝗥𝗗 𝗙𝗢𝗥𝗠𝗔𝗧
Date: May 10
Symbol: XYZ
Five-Point Score: 4
Day 1 Result: Rejection Confirmed
Day 3 Return: −2.1%
Day 5 Return: −3.4%
𝗔𝗩𝗢𝗜𝗗 𝗦𝗘𝗟𝗘𝗖𝗧𝗜𝗢𝗡 𝗕𝗜𝗔𝗦
Do not select only famous or obvious failed breakouts.
Use a fixed list of stocks and a fixed historical period. Record every setup that meets the original definition, including weak and unresolved examples.
The framework becomes interesting only if high-scoring setups produce consistently different results from low-scoring setups.
𝗙𝗜𝗡𝗔𝗟 𝗣𝗥𝗢𝗖𝗘𝗦𝗦
Mark the level → Wait for the close → Calculate the score → Classify Day 1 → Record the results
A useful market framework should not depend on one attractive chart. It should use clear definitions, repeatable rules and enough historical observations to show whether the idea deserves further research.
𝗗𝗜𝗦𝗖𝗟𝗔𝗜𝗠𝗘𝗥
This material is provided for educational and research purposes only. It is not financial advice or a guaranteed trading strategy. Test the framework with Bar Replay or paper trading before considering any real-money decision.
Uwaga

Wyłączenie odpowiedzialności
Informacje i publikacje nie stanowią i nie powinny być traktowane jako porady finansowe, inwestycyjne, tradingowe ani jakiekolwiek inne rekomendacje dostarczane lub zatwierdzone przez TradingView. Więcej informacji znajduje się w Warunkach użytkowania.
Wyłączenie odpowiedzialności
Informacje i publikacje nie stanowią i nie powinny być traktowane jako porady finansowe, inwestycyjne, tradingowe ani jakiekolwiek inne rekomendacje dostarczane lub zatwierdzone przez TradingView. Więcej informacji znajduje się w Warunkach użytkowania.