
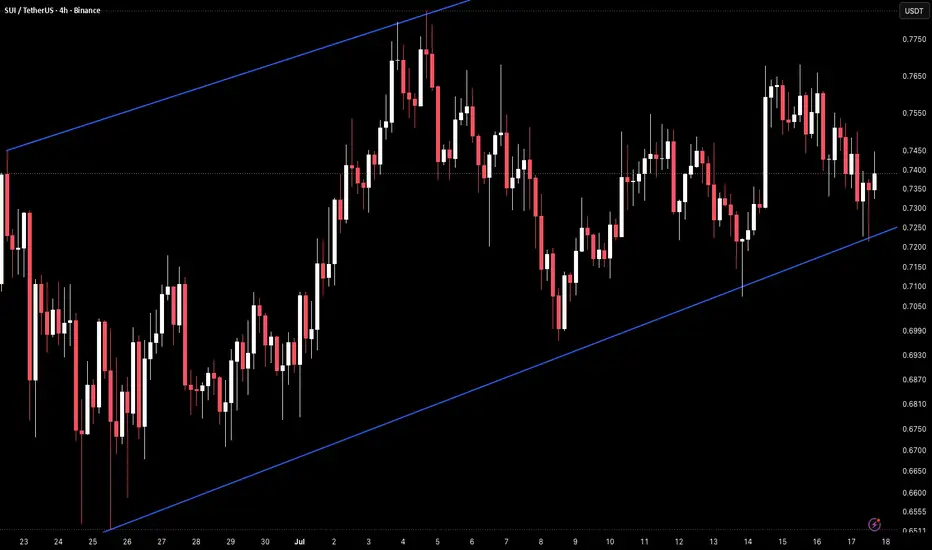
SUI on the 4H timeframe is currently trading around 0.7385 after pulling back from the upper channel boundary near 0.7750–0.7800 and finding support at the rising lower trendline near 0.7100–0.7200, with price now back at the 0.7380–0.7400 horizontal pivot that has defined the midline of the structure throughout the channel.
The chart shows a rising parallel channel originating from the late June low near 0.6510, with the lower trendline connecting the June 25 bottom through the July 8 low near 0.6990 and the July 14 low near 0.7100, while the upper trendline has capped the July 4 high near 0.7750–0.7800 and the July 15 high near 0.7650–0.7700. Price has made two full oscillations inside the channel, pushing from the lower boundary to the upper boundary and back twice. The horizontal level near 0.7380–0.7400 has acted as the central pivot throughout, with price repeatedly crossing through it in both directions. The most recent pullback from the upper boundary brought price back to the lower trendline near 0.7100 on July 14 before bouncing, and the current candle is now back at the 0.7380–0.7400 pivot with the upper boundary near 0.7650–0.7700 as the next target if the level holds.
The rising lower trendline has now been tested three times without a breakdown, each time producing a recovery back toward the upper boundary, keeping the bullish channel structure fully intact.
Key Levels To Watch
→ 0.7750–0.7800 – Upper channel boundary, major resistance (dynamic)
→ 0.7650–0.7700 – Prior upper boundary touch, resistance
→ 0.7500–0.7550 – Mid-upper channel zone, resistance
→ 0.7380–0.7400 – Horizontal pivot, current price zone
→ 0.7200–0.7250 – Mid-lower channel zone, support
→ 0.7100–0.7150 – Rising lower trendline, dynamic support (climbing)
→ Below 0.6990 – Channel breakdown, bullish structure invalidated
A hold above the 0.7380–0.7400 horizontal pivot and a push toward the upper channel boundary near 0.7650–0.7700 would continue the established pattern of channel oscillations and keep the bullish structure intact, with 0.7750–0.7800 as the full upper boundary target.
A loss of the 0.7380–0.7400 pivot and a return toward the rising lower trendline near 0.7100–0.7150 would be the fourth trendline test, and a confirmed close below it would break the channel structure that has held since late June, opening downside toward 0.6990 and below.
Third trendline hold produced bounce back to horizontal pivot, channel pattern consistent. Hold
0.7380–0.7400 → upper boundary near 0.7650–0.7800 back in play. Lose pivot and trendline near 0.7100 → channel structure broken, downside toward 0.6990. Bias bullish inside rising channel. Shift only on confirmed close below rising lower trendline.
The chart shows a rising parallel channel originating from the late June low near 0.6510, with the lower trendline connecting the June 25 bottom through the July 8 low near 0.6990 and the July 14 low near 0.7100, while the upper trendline has capped the July 4 high near 0.7750–0.7800 and the July 15 high near 0.7650–0.7700. Price has made two full oscillations inside the channel, pushing from the lower boundary to the upper boundary and back twice. The horizontal level near 0.7380–0.7400 has acted as the central pivot throughout, with price repeatedly crossing through it in both directions. The most recent pullback from the upper boundary brought price back to the lower trendline near 0.7100 on July 14 before bouncing, and the current candle is now back at the 0.7380–0.7400 pivot with the upper boundary near 0.7650–0.7700 as the next target if the level holds.
The rising lower trendline has now been tested three times without a breakdown, each time producing a recovery back toward the upper boundary, keeping the bullish channel structure fully intact.
Key Levels To Watch
→ 0.7750–0.7800 – Upper channel boundary, major resistance (dynamic)
→ 0.7650–0.7700 – Prior upper boundary touch, resistance
→ 0.7500–0.7550 – Mid-upper channel zone, resistance
→ 0.7380–0.7400 – Horizontal pivot, current price zone
→ 0.7200–0.7250 – Mid-lower channel zone, support
→ 0.7100–0.7150 – Rising lower trendline, dynamic support (climbing)
→ Below 0.6990 – Channel breakdown, bullish structure invalidated
A hold above the 0.7380–0.7400 horizontal pivot and a push toward the upper channel boundary near 0.7650–0.7700 would continue the established pattern of channel oscillations and keep the bullish structure intact, with 0.7750–0.7800 as the full upper boundary target.
A loss of the 0.7380–0.7400 pivot and a return toward the rising lower trendline near 0.7100–0.7150 would be the fourth trendline test, and a confirmed close below it would break the channel structure that has held since late June, opening downside toward 0.6990 and below.
Third trendline hold produced bounce back to horizontal pivot, channel pattern consistent. Hold
0.7380–0.7400 → upper boundary near 0.7650–0.7800 back in play. Lose pivot and trendline near 0.7100 → channel structure broken, downside toward 0.6990. Bias bullish inside rising channel. Shift only on confirmed close below rising lower trendline.

Wyłączenie odpowiedzialności
Informacje i publikacje nie stanowią i nie powinny być traktowane jako porady finansowe, inwestycyjne, tradingowe ani jakiekolwiek inne rekomendacje dostarczane lub zatwierdzone przez TradingView. Więcej informacji znajduje się w Warunkach użytkowania.
Wyłączenie odpowiedzialności
Informacje i publikacje nie stanowią i nie powinny być traktowane jako porady finansowe, inwestycyjne, tradingowe ani jakiekolwiek inne rekomendacje dostarczane lub zatwierdzone przez TradingView. Więcej informacji znajduje się w Warunkach użytkowania.