SUNTV1!
27-11
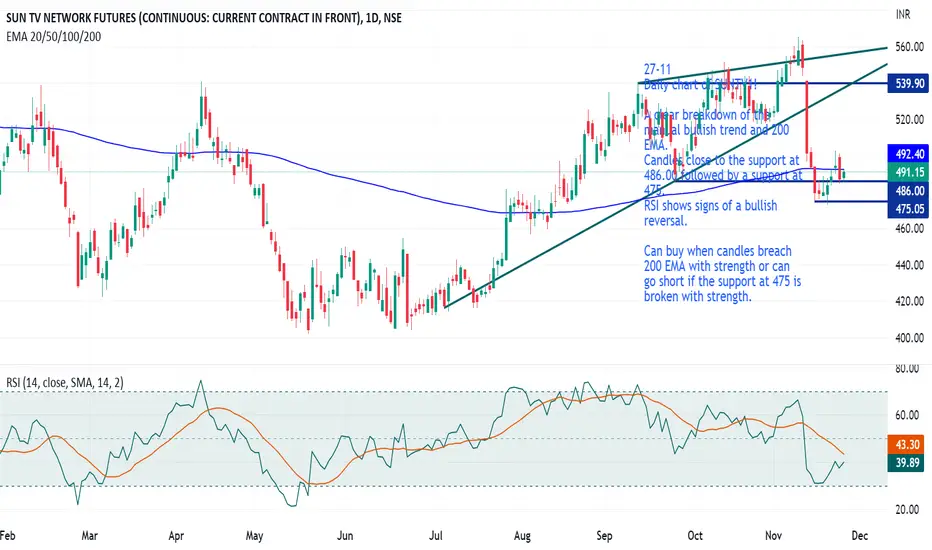
Daily chart of SUNTV1!
A clear breakdown of the manual bullish trend and 200 EMA.
Candles close to the support at 486.00 followed by a support at 475.
RSI shows signs of a bullish reversal.
Can buy when candles breach 200 EMA with strength or can go short if the support at 475 is broken with strength.
Daily chart of SUNTV1!
A clear breakdown of the manual bullish trend and 200 EMA.
Candles close to the support at 486.00 followed by a support at 475.
RSI shows signs of a bullish reversal.
Can buy when candles breach 200 EMA with strength or can go short if the support at 475 is broken with strength.

Wyłączenie odpowiedzialności
Informacje i publikacje nie stanowią i nie powinny być traktowane jako porady finansowe, inwestycyjne, tradingowe ani jakiekolwiek inne rekomendacje dostarczane lub zatwierdzone przez TradingView. Więcej informacji znajduje się w Warunkach użytkowania.
Wyłączenie odpowiedzialności
Informacje i publikacje nie stanowią i nie powinny być traktowane jako porady finansowe, inwestycyjne, tradingowe ani jakiekolwiek inne rekomendacje dostarczane lub zatwierdzone przez TradingView. Więcej informacji znajduje się w Warunkach użytkowania.