
Technical Analysis of Systems Limited (SYS) - PSX
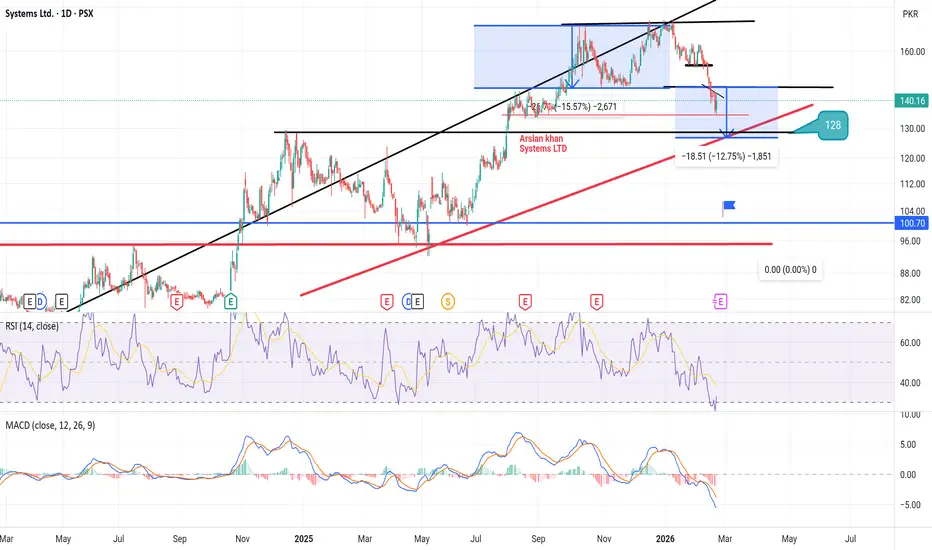
The Systems Limited (SYS) daily chart reveals a stock in a prolonged uptrend since early 2024, captured within a well-defined ascending channel (black trendlines). However, following a peak near 174.40 PKR in late December 2025, the price has entered a corrective phase, characterized by a series of lower highs and lows under a descending red trendline. As of the latest session (February 20, 2026), SYS closed at 140.16 PKR, up +2.77% (+3.78 PKR) on the day, with an intraday low of 135.00 PKR (close to the targeted 134.79 PKR level). This session saw volume of approximately 1.8 million shares, indicating decent participation amid the bounce.
The price has so far dropped to our targets at PKR 134.79; this level has acted as a strong support in the past, aligning with prior swing lows and the 61.8% Fibonacci retracement of the major upmove from mid-2025 lows. Buyers have dived in, and the price immediately retracted from that level, staging a sharp intraday recovery to highs of 143.00 PKR. However, the retracement met strong resistance on its way upwards, stalling near the 143 PKR area (confluence of the descending red trendline and recent minor highs). This rejection reinforces the ongoing bearish momentum in the short term.
Key Technical Elements
Price Structure: The stock remains in a long-term bullish channel, with the upper boundary projecting toward 160-170 PKR and the lower boundary around 129 PKR. The recent pullback appears to follow an Elliott Wave corrective pattern, labeled with (D), (E), etc., suggesting a complex ABC correction or Wave 4 pullback. The downside move has respected the channel so far, but pressure is building.
Support and Resistance:
Immediate support: 134.79-135 PKR (recent low, tested and held).
Next downside target: 129 PKR – a strong support is expected at that level, as that is the lower boundary of the long-term channel. This could act as a major value zone for accumulation.
Deeper risk: A fall below the lower trendline will push the price downwards to PKR 100, coinciding with the 2025 lows and extended Fibonacci levels (78.6% retracement).
Resistance: 143-145 PKR (recent high, descending trendline), followed by 150-155 PKR (mid-channel area).
Momentum Indicators:
RSI(14): At 33.03, firmly in oversold territory (<40), signaling potential exhaustion of sellers. A divergence here (higher low in RSI vs. price) could foreshadow a reversal if the bounce sustains.
MACD(12,26,9): Bearish with the line at -1.65, signal at -5.51, and histogram at -3.86. The narrowing histogram suggests weakening downside momentum, but a bullish crossover is needed for confirmation.
Volume: The bounce off the low came on solid volume, which is constructive, but follow-through buying is essential to break the descending trendline.
Scenarios Moving Forward
Bullish Case: A sustained close above 143 PKR would invalidate the short-term downtrend, opening the door to a retest of 150-155 PKR and potentially the channel midline. This could be fueled by positive fundamentals, such as Systems Ltd.'s growth in IT services and exports amid Pakistan's tech sector expansion. Oversold conditions support a relief rally toward 160 PKR if global risk sentiment improves.
Bearish Case (Base Scenario): Failure to hold the 135 PKR support resumes the correction, targeting 129 PKR first. A clean break below the channel's lower boundary accelerates downside to 100 PKR, especially if broader PSX weakness (e.g., from economic pressures or rupee volatility) persists.
Risk Management: Use stops below 134 PKR for longs; watch volume on any retest of lows. The overall uptrend remains intact above the channel low, making dips attractive for long-term investors.
This setup highlights a classic channel correction with oversold readings – dip buyers may find opportunity at supports, but caution is warranted until resistance breaks. Not financial advice; consider company-specific news, like earnings or acquisitions, which could influence the trajectory.
#SYS #SystemsLtd #PSX #PakistanStockExchange #StockAnalysis #TradingView #TechnicalAnalysis #ElliottWave #ChannelTrading #Oversold #PakistanMarkets #ITStocks
The Systems Limited (SYS) daily chart reveals a stock in a prolonged uptrend since early 2024, captured within a well-defined ascending channel (black trendlines). However, following a peak near 174.40 PKR in late December 2025, the price has entered a corrective phase, characterized by a series of lower highs and lows under a descending red trendline. As of the latest session (February 20, 2026), SYS closed at 140.16 PKR, up +2.77% (+3.78 PKR) on the day, with an intraday low of 135.00 PKR (close to the targeted 134.79 PKR level). This session saw volume of approximately 1.8 million shares, indicating decent participation amid the bounce.
The price has so far dropped to our targets at PKR 134.79; this level has acted as a strong support in the past, aligning with prior swing lows and the 61.8% Fibonacci retracement of the major upmove from mid-2025 lows. Buyers have dived in, and the price immediately retracted from that level, staging a sharp intraday recovery to highs of 143.00 PKR. However, the retracement met strong resistance on its way upwards, stalling near the 143 PKR area (confluence of the descending red trendline and recent minor highs). This rejection reinforces the ongoing bearish momentum in the short term.
Key Technical Elements
Price Structure: The stock remains in a long-term bullish channel, with the upper boundary projecting toward 160-170 PKR and the lower boundary around 129 PKR. The recent pullback appears to follow an Elliott Wave corrective pattern, labeled with (D), (E), etc., suggesting a complex ABC correction or Wave 4 pullback. The downside move has respected the channel so far, but pressure is building.
Support and Resistance:
Immediate support: 134.79-135 PKR (recent low, tested and held).
Next downside target: 129 PKR – a strong support is expected at that level, as that is the lower boundary of the long-term channel. This could act as a major value zone for accumulation.
Deeper risk: A fall below the lower trendline will push the price downwards to PKR 100, coinciding with the 2025 lows and extended Fibonacci levels (78.6% retracement).
Resistance: 143-145 PKR (recent high, descending trendline), followed by 150-155 PKR (mid-channel area).
Momentum Indicators:
RSI(14): At 33.03, firmly in oversold territory (<40), signaling potential exhaustion of sellers. A divergence here (higher low in RSI vs. price) could foreshadow a reversal if the bounce sustains.
MACD(12,26,9): Bearish with the line at -1.65, signal at -5.51, and histogram at -3.86. The narrowing histogram suggests weakening downside momentum, but a bullish crossover is needed for confirmation.
Volume: The bounce off the low came on solid volume, which is constructive, but follow-through buying is essential to break the descending trendline.
Scenarios Moving Forward
Bullish Case: A sustained close above 143 PKR would invalidate the short-term downtrend, opening the door to a retest of 150-155 PKR and potentially the channel midline. This could be fueled by positive fundamentals, such as Systems Ltd.'s growth in IT services and exports amid Pakistan's tech sector expansion. Oversold conditions support a relief rally toward 160 PKR if global risk sentiment improves.
Bearish Case (Base Scenario): Failure to hold the 135 PKR support resumes the correction, targeting 129 PKR first. A clean break below the channel's lower boundary accelerates downside to 100 PKR, especially if broader PSX weakness (e.g., from economic pressures or rupee volatility) persists.
Risk Management: Use stops below 134 PKR for longs; watch volume on any retest of lows. The overall uptrend remains intact above the channel low, making dips attractive for long-term investors.
This setup highlights a classic channel correction with oversold readings – dip buyers may find opportunity at supports, but caution is warranted until resistance breaks. Not financial advice; consider company-specific news, like earnings or acquisitions, which could influence the trajectory.
#SYS #SystemsLtd #PSX #PakistanStockExchange #StockAnalysis #TradingView #TechnicalAnalysis #ElliottWave #ChannelTrading #Oversold #PakistanMarkets #ITStocks
Uwaga
Price has achieved our target today. Patience is the key.Zlecenie aktywne
The flag area at 100pkr which looked unrealistic is near. The price is at 106 pkr today. In another post i have shared my further projection.
Wyłączenie odpowiedzialności
Informacje i publikacje nie stanowią i nie powinny być traktowane jako porady finansowe, inwestycyjne, tradingowe ani jakiekolwiek inne rekomendacje dostarczane lub zatwierdzone przez TradingView. Więcej informacji znajduje się w Warunkach użytkowania.
Wyłączenie odpowiedzialności
Informacje i publikacje nie stanowią i nie powinny być traktowane jako porady finansowe, inwestycyjne, tradingowe ani jakiekolwiek inne rekomendacje dostarczane lub zatwierdzone przez TradingView. Więcej informacji znajduje się w Warunkach użytkowania.