
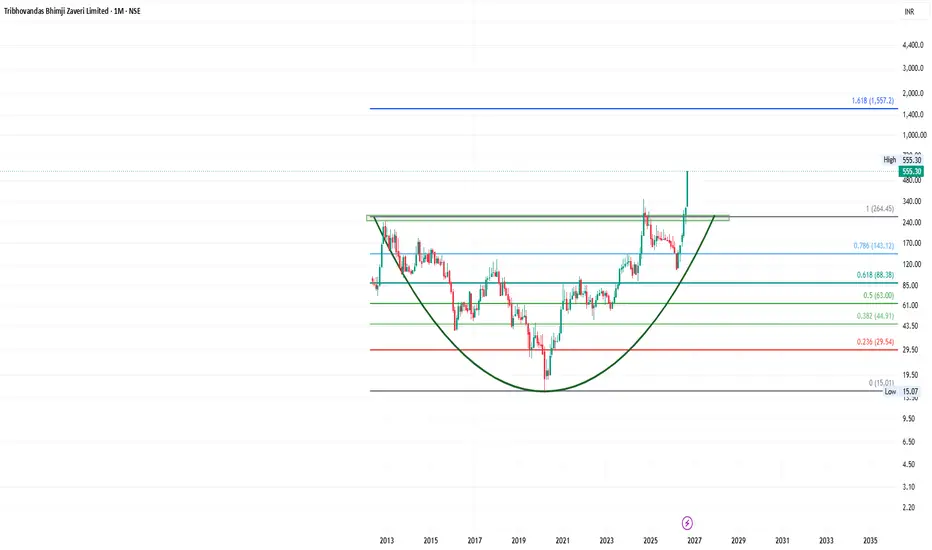
TBZ exhibits a multi-year Rounding Bottom / Cup Pattern Breakout on the monthly chart, having decisively crossed its decade-long neckline at ₹264.45. Based on structural wave expansion and Fibonacci projections, the stock holds technical potential to move ~50% higher from current market levels (~₹555) toward ₹830 – ₹835 over a 6 to 12-month horizon.
Key Technical Drivers
• Decadal Base Breakout: The monthly timeframe reveals a massive rounding bottom accumulation pattern spanning over 10 years (2014–2024), shifting the stock from a long-term bottoming structure into a hyper-bullish discovery phase.
• Volume Expansion & Momentum: The breakout above ₹264 was accompanied by massive trading volume expansion, confirming institutional absorption and trend validation.
• Fibonacci Target Trajectory:
o Pattern Neckline (1.0 Fib): ₹264.45
o Current Price (CMP): ~₹555.30
o First Upside Hurdle: ₹705.00
o 50% Target Zone (+50% from CMP): ₹830.00 – ₹835.00
o Extended Macro Target (1.618 Fib Extension): ₹1,557.20
Support Levels & Risk Management
• Immediate Support Zone: ₹480 – ₹500 (Previous local high acting as short-term floor).
• Major Structural Support: ₹360 – ₹430 (Key demand zone on any broader market consolidation).
• Invalidation Threshold: A monthly close below ₹308 invalidates the immediate continuation setup.
Trading & Investment Strategy
Positioning favors buying on dips toward the ₹480–₹510 zone rather than chasing vertical momentum at current highs. A trailing stop-loss below key support levels allows participation in the move toward the ₹830+ target while managing risk effectively.
Learn & Earn with Chartsboltahai. Happy Investing.

Wyłączenie odpowiedzialności
Informacje i publikacje nie stanowią i nie powinny być traktowane jako porady finansowe, inwestycyjne, tradingowe ani jakiekolwiek inne rekomendacje dostarczane lub zatwierdzone przez TradingView. Więcej informacji znajduje się w Warunkach użytkowania.
Wyłączenie odpowiedzialności
Informacje i publikacje nie stanowią i nie powinny być traktowane jako porady finansowe, inwestycyjne, tradingowe ani jakiekolwiek inne rekomendacje dostarczane lub zatwierdzone przez TradingView. Więcej informacji znajduje się w Warunkach użytkowania.