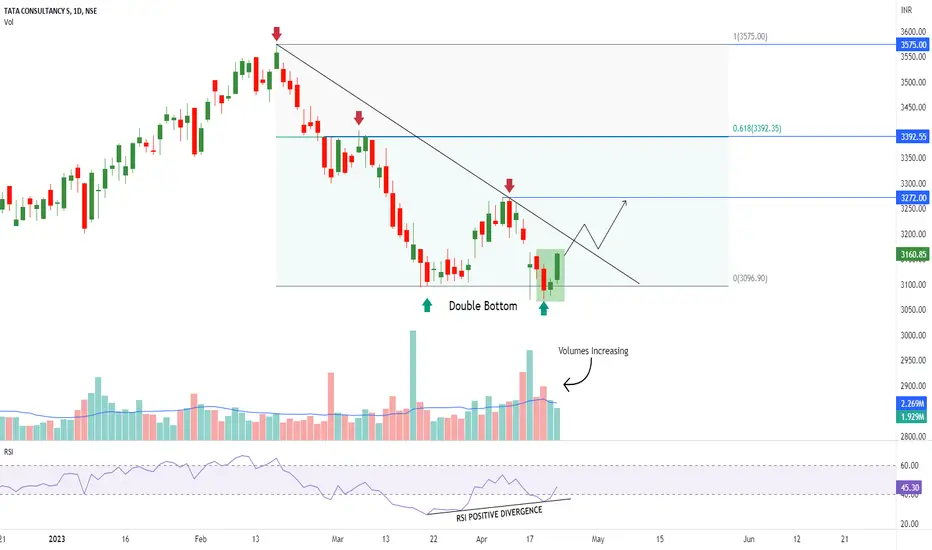
 TCS is trading at its important weekly support level.
On Daily chart it has formed kind of Morning Star Candlestick Pattern & Double Bottom Price Action Pattern.
Positive RSI Divergence is also seen.
Volume is still rising, which suggests that there is more upside potential for the stock.
- Support- 3100
Resistance- 3275/3400/3575

Wyłączenie odpowiedzialności
Informacje i publikacje nie stanowią i nie powinny być traktowane jako porady finansowe, inwestycyjne, tradingowe ani jakiekolwiek inne rekomendacje dostarczane lub zatwierdzone przez TradingView. Więcej informacji znajduje się w Warunkach użytkowania.
Wyłączenie odpowiedzialności
Informacje i publikacje nie stanowią i nie powinny być traktowane jako porady finansowe, inwestycyjne, tradingowe ani jakiekolwiek inne rekomendacje dostarczane lub zatwierdzone przez TradingView. Więcej informacji znajduje się w Warunkach użytkowania.