
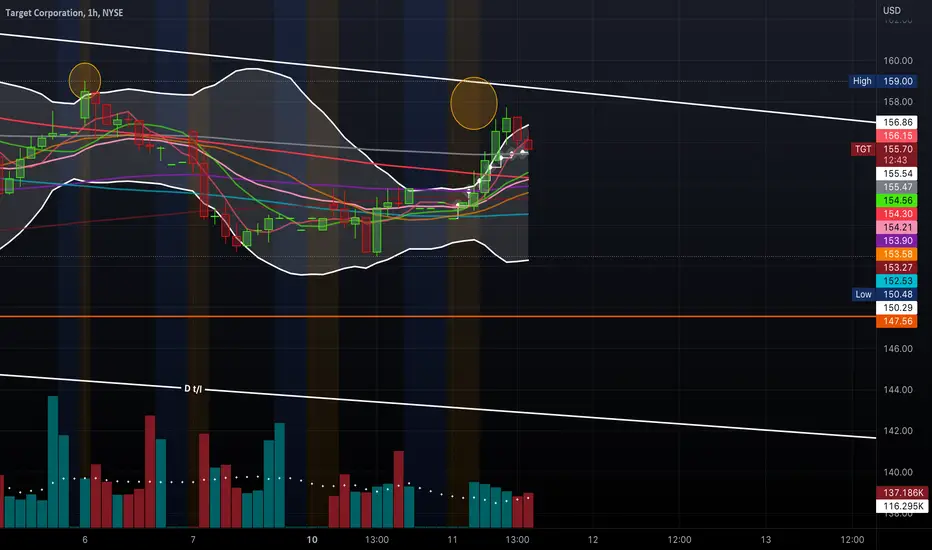
Target With A "Bullseye"?
I've identified a falling wedge pattern on Target's daily chart. Also, the RSI indicator shows higher highs and higher lows.
Short float % for TGT was at 2.02% at time of this post.
TGT is a good candidate for a swing. I have my "Bullseye" above 159 or at the break of the upper trendline.

*This is not financial advice.
I've identified a falling wedge pattern on Target's daily chart. Also, the RSI indicator shows higher highs and higher lows.
Short float % for TGT was at 2.02% at time of this post.
TGT is a good candidate for a swing. I have my "Bullseye" above 159 or at the break of the upper trendline.
*This is not financial advice.

Wyłączenie odpowiedzialności
Informacje i publikacje nie stanowią i nie powinny być traktowane jako porady finansowe, inwestycyjne, tradingowe ani jakiekolwiek inne rekomendacje dostarczane lub zatwierdzone przez TradingView. Więcej informacji znajduje się w Warunkach użytkowania.
Wyłączenie odpowiedzialności
Informacje i publikacje nie stanowią i nie powinny być traktowane jako porady finansowe, inwestycyjne, tradingowe ani jakiekolwiek inne rekomendacje dostarczane lub zatwierdzone przez TradingView. Więcej informacji znajduje się w Warunkach użytkowania.