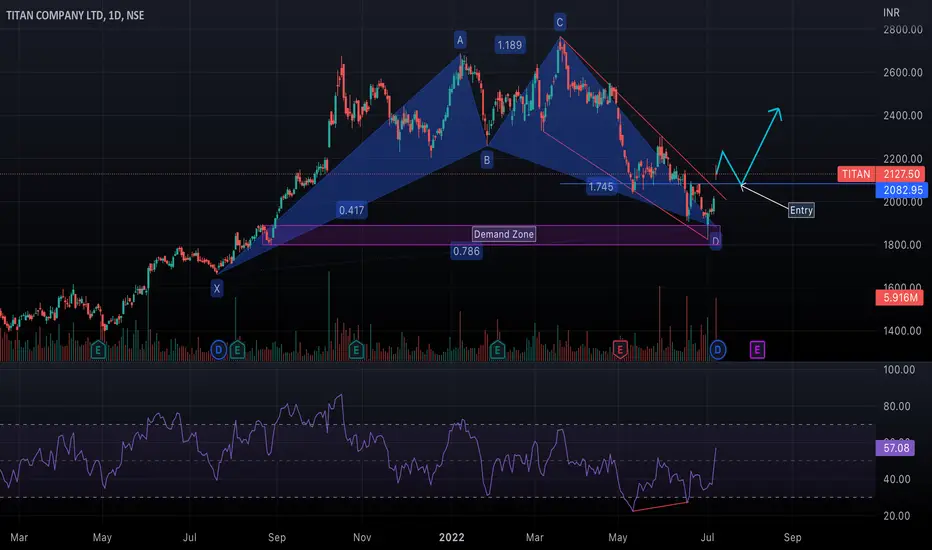
Let's understand multi timeframe analysis for  TITAN.
Weekly TF -
TITAN has been trading in a falling wedge pattern (LH-LL) and has recently re-tested a major demand zone. A bullish engulfing candlestick has been formed. There's an additional confluence of Harmonic Cypher PRZ around 1880.

Daily TF -
Bullish RSI divergence has been seen on daily TF. Price gaped up and did a breakout from a falling wedge structure. Short term bullish entry can be taken if price retraces back to 2080 level which was acting as a resistance earlier.

TITAN.Weekly TF -
TITAN has been trading in a falling wedge pattern (LH-LL) and has recently re-tested a major demand zone. A bullish engulfing candlestick has been formed. There's an additional confluence of Harmonic Cypher PRZ around 1880.Daily TF -
Bullish RSI divergence has been seen on daily TF. Price gaped up and did a breakout from a falling wedge structure. Short term bullish entry can be taken if price retraces back to 2080 level which was acting as a resistance earlier.
Uwaga
Price reversed as per the analysis and moved higher.
Wyłączenie odpowiedzialności
Informacje i publikacje nie stanowią i nie powinny być traktowane jako porady finansowe, inwestycyjne, tradingowe ani jakiekolwiek inne rekomendacje dostarczane lub zatwierdzone przez TradingView. Więcej informacji znajduje się w Warunkach użytkowania.
Wyłączenie odpowiedzialności
Informacje i publikacje nie stanowią i nie powinny być traktowane jako porady finansowe, inwestycyjne, tradingowe ani jakiekolwiek inne rekomendacje dostarczane lub zatwierdzone przez TradingView. Więcej informacji znajduje się w Warunkach użytkowania.