
TITAN Cement: Low Carbon, Low Debt, Low Price — But for How Long?
The Greek cement giant TITAN (TITC) is quietly building momentum. Despite a flat top line (+0.4% revenue YoY in H1 2025), TITAN grew EBITDA by 2% to €286.9M, boosted by cost control and a strategic shift to alternative fuels. In Greece, EBITDA soared 20% on the back of construction activity and expense discipline.
The group’s net debt plummeted from €622M to €137M in just six months, with a Net Debt/EBITDA ratio of 0.2x—unlocking major optionality for M\&A, dividends, or buybacks.
But what really stands out?
- ESG Competitive Moat: TITAN leads in low-carbon cement (CEM IV), positioning itself ahead of regulatory curves across the EU. Alternative fuels now account for 40%+ in some regions.
- Valuation Disconnect: The stock trades at just 4.7x EV/EBITDA, while ESG peers sit at 6–7.5x. A rerating could imply up to 60% upside.
- Strong Catalysts Ahead:
1. U.S. housing rebound in 2025–26 (Titan America exposure)
2. Buybacks/dividend hike due to surplus cash flow
3. Entry into EU/EIB-funded green projects
4. Second IPO or spin-off of Titan America or ESG vertical
5. Technical Setup:
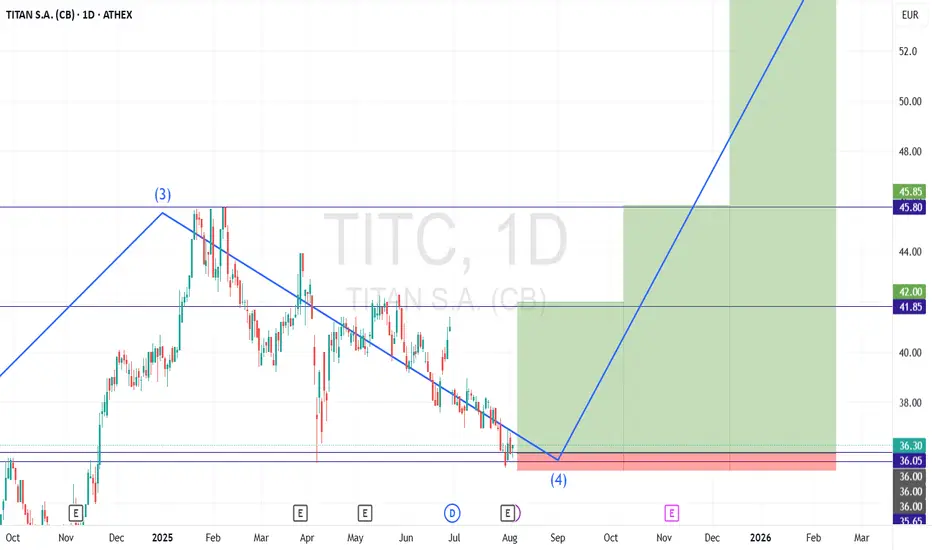
i) Price is testing long-term ascending channel support (€34.30–€35.50), with a potential upside target of €55.30 (+52%).
ii) Currently in Wave 4 of the Elliott Wave cycle on the monthly timeframe, suggesting a potential Wave 5 rally ahead.
iii) Entering a key value-buying zone — the same price region where the April 2025 bullish rally was initiated.
Conclusion: TITAN is underpriced, under-leveraged, and ESG-ready. The next 6–18 months could unlock major revaluation.
Ticker: TITC
Watch Zones:
- Entry Area: €34.30–€35.50 (support)
- SL Area: €35-€35.30 (below latest swing low)
-TP1 Area: €42 (target 1 - Previous consolidation levels) - R:R 8.57
-TP2 Area: €45.85 (target 2 - Previous Highs) - R:R 14.07
-TP3 Area: €55 (target 3 - According to EV/EBITDA Multiples) - R:R 27.07
-Return: From 16.67% to 52.64%
Happy Profits to everyone!!
At your disposal for any questions!!
THE GREEK TRADER
The Greek cement giant TITAN (TITC) is quietly building momentum. Despite a flat top line (+0.4% revenue YoY in H1 2025), TITAN grew EBITDA by 2% to €286.9M, boosted by cost control and a strategic shift to alternative fuels. In Greece, EBITDA soared 20% on the back of construction activity and expense discipline.
The group’s net debt plummeted from €622M to €137M in just six months, with a Net Debt/EBITDA ratio of 0.2x—unlocking major optionality for M\&A, dividends, or buybacks.
But what really stands out?
- ESG Competitive Moat: TITAN leads in low-carbon cement (CEM IV), positioning itself ahead of regulatory curves across the EU. Alternative fuels now account for 40%+ in some regions.
- Valuation Disconnect: The stock trades at just 4.7x EV/EBITDA, while ESG peers sit at 6–7.5x. A rerating could imply up to 60% upside.
- Strong Catalysts Ahead:
1. U.S. housing rebound in 2025–26 (Titan America exposure)
2. Buybacks/dividend hike due to surplus cash flow
3. Entry into EU/EIB-funded green projects
4. Second IPO or spin-off of Titan America or ESG vertical
5. Technical Setup:
i) Price is testing long-term ascending channel support (€34.30–€35.50), with a potential upside target of €55.30 (+52%).
ii) Currently in Wave 4 of the Elliott Wave cycle on the monthly timeframe, suggesting a potential Wave 5 rally ahead.
iii) Entering a key value-buying zone — the same price region where the April 2025 bullish rally was initiated.
Conclusion: TITAN is underpriced, under-leveraged, and ESG-ready. The next 6–18 months could unlock major revaluation.
Ticker: TITC
Watch Zones:
- Entry Area: €34.30–€35.50 (support)
- SL Area: €35-€35.30 (below latest swing low)
-TP1 Area: €42 (target 1 - Previous consolidation levels) - R:R 8.57
-TP2 Area: €45.85 (target 2 - Previous Highs) - R:R 14.07
-TP3 Area: €55 (target 3 - According to EV/EBITDA Multiples) - R:R 27.07
-Return: From 16.67% to 52.64%
Happy Profits to everyone!!
At your disposal for any questions!!
THE GREEK TRADER

Wyłączenie odpowiedzialności
Informacje i publikacje nie stanowią i nie powinny być traktowane jako porady finansowe, inwestycyjne, tradingowe ani jakiekolwiek inne rekomendacje dostarczane lub zatwierdzone przez TradingView. Więcej informacji znajduje się w Warunkach użytkowania.
Wyłączenie odpowiedzialności
Informacje i publikacje nie stanowią i nie powinny być traktowane jako porady finansowe, inwestycyjne, tradingowe ani jakiekolwiek inne rekomendacje dostarczane lub zatwierdzone przez TradingView. Więcej informacji znajduje się w Warunkach użytkowania.