
Part 1
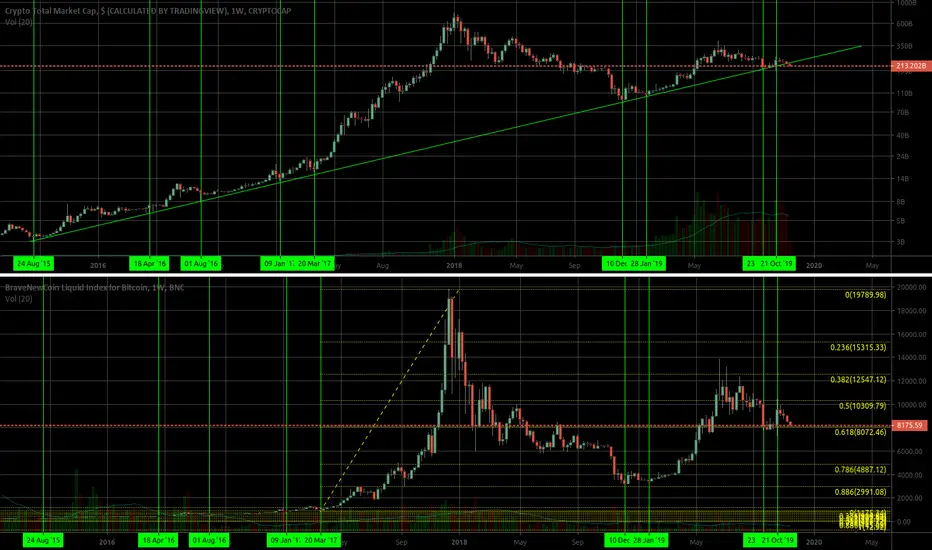
Logarythmic chart of marketcap compared with standard chart of BTCUSD
To date, log chart of marketcap has remained above a trendline that was created in 2015. Weekly candles wicked below during the week of Oct 21, 2019; but closed above (first instance of pushing below this since start of trend). Current weekly candle opened below trendline. Every previous instance of testing this trendline has resulted in a major trend change (if following a massive downtrend), or at least an uptick in price (if not first touch after large downtrend). Outcome and significance of opening below trend is TBD once current weekly candle closes.
Logarythmic chart of marketcap compared with standard chart of BTCUSD
To date, log chart of marketcap has remained above a trendline that was created in 2015. Weekly candles wicked below during the week of Oct 21, 2019; but closed above (first instance of pushing below this since start of trend). Current weekly candle opened below trendline. Every previous instance of testing this trendline has resulted in a major trend change (if following a massive downtrend), or at least an uptick in price (if not first touch after large downtrend). Outcome and significance of opening below trend is TBD once current weekly candle closes.

Wyłączenie odpowiedzialności
Informacje i publikacje nie stanowią i nie powinny być traktowane jako porady finansowe, inwestycyjne, tradingowe ani jakiekolwiek inne rekomendacje dostarczane lub zatwierdzone przez TradingView. Więcej informacji znajduje się w Warunkach użytkowania.
Wyłączenie odpowiedzialności
Informacje i publikacje nie stanowią i nie powinny być traktowane jako porady finansowe, inwestycyjne, tradingowe ani jakiekolwiek inne rekomendacje dostarczane lub zatwierdzone przez TradingView. Więcej informacji znajduje się w Warunkach użytkowania.