
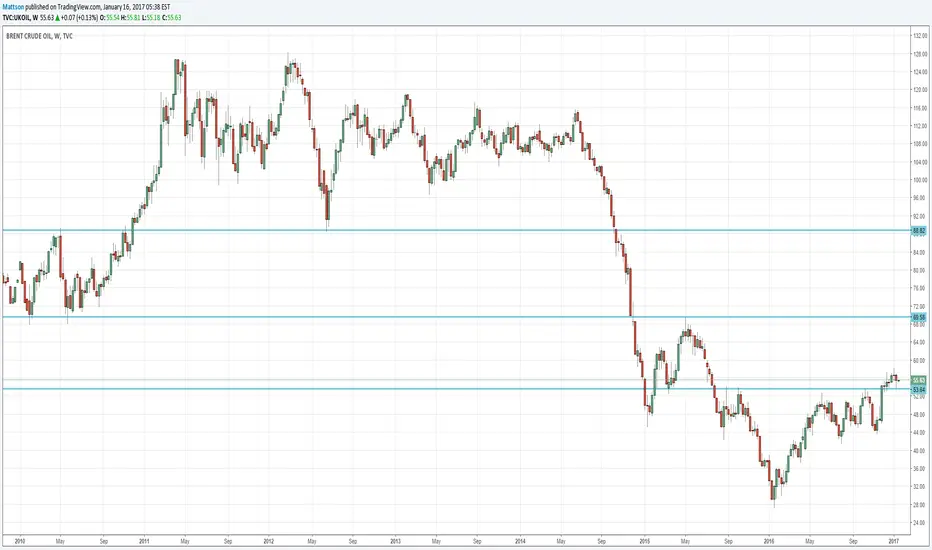
Inverse head and shoulder pettern that broke out in november last year. After it broke out it retested the breakout line and managed to hold it.
Long: above 58,25
S/L: 53,50
TP1: 69,5
TP2: 88
Timeframe 4-5 months
Long: above 58,25
S/L: 53,50
TP1: 69,5
TP2: 88
Timeframe 4-5 months
Uwaga
It does looks like a head and shoulder pattern is emerging in daily chart, but I think its too small to change the current trend. Neckline break is at 53,50. I will change my strategy for entry if the neckline breaks. Will be looking for an long entry at 50 level if 53,50 breaks.Uwaga
Oil looks really strong, I will have a buy stop at 58.30 and S/L at 53.50 and aim for 85.
Wyłączenie odpowiedzialności
Informacje i publikacje nie stanowią i nie powinny być traktowane jako porady finansowe, inwestycyjne, tradingowe ani jakiekolwiek inne rekomendacje dostarczane lub zatwierdzone przez TradingView. Więcej informacji znajduje się w Warunkach użytkowania.
Wyłączenie odpowiedzialności
Informacje i publikacje nie stanowią i nie powinny być traktowane jako porady finansowe, inwestycyjne, tradingowe ani jakiekolwiek inne rekomendacje dostarczane lub zatwierdzone przez TradingView. Więcej informacji znajduje się w Warunkach użytkowania.