
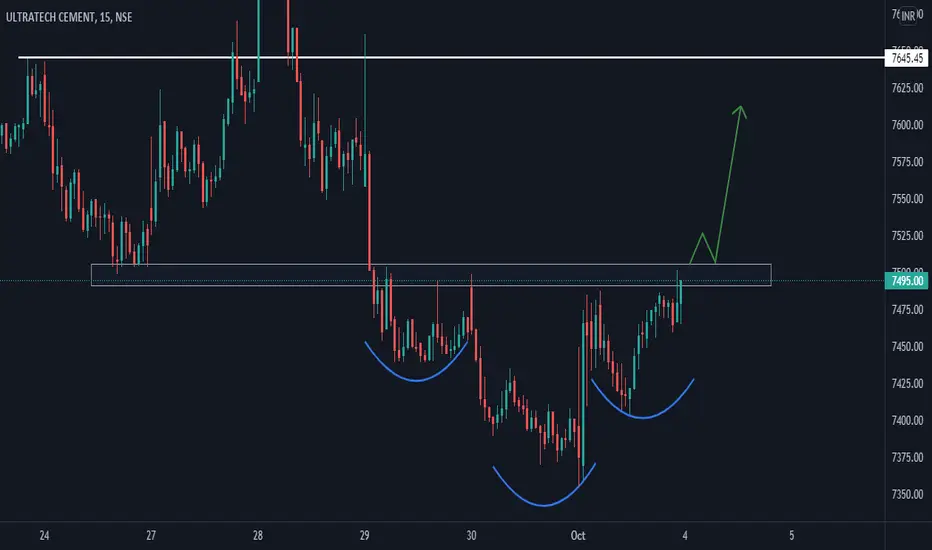
EXPLANATION: This is a 15 min time frame chart of ULTRACEMCO . The stock has been in a downtrend for days and has formed an Inverted head and shoulders pattern. If stock give a strong breakout and broke its supply zone with volumes and has retested the same. I am bullish on ULTRACEMCO .
If you like this analysis give a Like // Follow for more updates , let me know in comments below :)
If you like this analysis give a Like // Follow for more updates , let me know in comments below :)

Wyłączenie odpowiedzialności
Informacje i publikacje nie stanowią i nie powinny być traktowane jako porady finansowe, inwestycyjne, tradingowe ani jakiekolwiek inne rekomendacje dostarczane lub zatwierdzone przez TradingView. Więcej informacji znajduje się w Warunkach użytkowania.
Wyłączenie odpowiedzialności
Informacje i publikacje nie stanowią i nie powinny być traktowane jako porady finansowe, inwestycyjne, tradingowe ani jakiekolwiek inne rekomendacje dostarczane lub zatwierdzone przez TradingView. Więcej informacji znajduje się w Warunkach użytkowania.