
💎 Coin: Uniswap  UNI
💱 Pair: UNI/USDT
⏳ Time Frame: 1 Day (1D)
📈 Pattern: Bull Flag (Descending Channel)
💰 Current Price: $7.5634
🎯 Potential Upside Targets: $8.60 – $10.25
📊 Market Bias: Bullish as long as the pattern structure remains intact.
## 🔍 1. Chart Structure Analysis
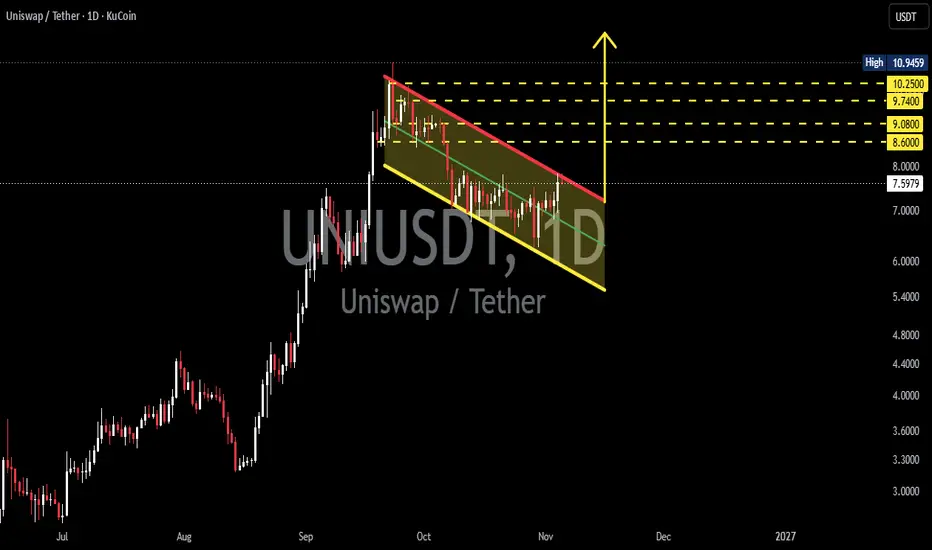
UNI is currently forming a potential Bull Flag pattern following a significant upward move from approximately $3.00 to a peak of around $10.94.
After this strong rally, the price entered a consolidation phase, forming a descending channel characterized by a series of lower highs and lower lows in the short term.
Interestingly, the current price action suggests that UNI is attempting to maintain support within this pattern.
📌 Key observations from the chart:
- 🚀 Strong Bullish Impulse: UNI previously experienced a significant upward move, forming the flagpole of the Bull Flag pattern.
- 📉 Descending Channel: Following the rally, the price began moving within a downward-sloping channel as part of its consolidation phase.
- 🟢 Potential Accumulation: This consolidation could represent a period of buying absorption before the price attempts to resume its upward trend.
- ⚡ Breakout Potential: If the price successfully breaks above the descending channel resistance, UNI could initiate its next bullish move.
## 📐 2. Understanding the Bull Flag Pattern
A Bull Flag is a bullish continuation pattern that typically develops after a strong upward price movement within a relatively short period.
This pattern consists of two main structures:
🚀 A. Flagpole
The flagpole represents a strong upward price movement before the market enters consolidation.
On the UNI chart, the rally from approximately $3.00 toward $10.94 represents the bullish impulse that forms the flagpole.
📉 B. Flag
After the significant rally, the price begins moving within a descending channel, with resistance gradually sloping downward.
This phase indicates that the market is undergoing consolidation following its previous rally.
⚡ C. Breakout Confirmation
The bullish outlook becomes stronger if the price successfully breaks above the descending channel resistance, accompanied by increasing trading volume and a daily candle close above resistance.
If the breakout is confirmed, the Bull Flag pattern could signal a continuation of the previous upward trend.
## 🟢 3. Bullish Scenario
The bullish scenario becomes increasingly attractive if UNI manages to break out of the descending channel and confirm a breakout above the red resistance trendline.
If buying pressure increases, the following resistance levels are worth monitoring:
| Target | Price Area |
|---|---:|
| 🎯 TP1 | $8.60 |
| 🎯 TP2 | $9.08 |
| 🎯 TP3 | $9.74 |
| 🚀 TP4 | $10.25 |
| 🔥 Previous High | $10.9459 |
Bullish Confirmation:
- 🟢 Price successfully breaks above the descending channel resistance.
- 📈 The daily candle closes above the resistance trendline.
- 📊 Trading volume increases during the breakout.
- 🔄 Price successfully retests and holds the breakout area as new support.
If these confirmations occur, UNI could continue its upward movement and retest the $10.25 resistance area, potentially challenging its previous high of $10.9459.
## 🔴 4. Bearish Scenario
Although the chart structure suggests a potential Bull Flag formation, a bullish breakout is not guaranteed.
UNI still faces the risk of rejection at the descending channel resistance.
Several bearish conditions should be monitored:
- ⚠️ Price fails to break above the red resistance trendline and faces renewed selling pressure.
- 📉 UNI loses bullish momentum and continues trading inside the descending channel.
- 🔻 Price breaks below the lower support boundary of the Bull Flag pattern.
- 🧨 A breakdown accompanied by increasing selling volume could invalidate the bullish scenario.
Key Support Areas to Watch:
- $7.00 – $6.80: Short-term support area.
- $6.50: Next potential support area, depending on the channel structure.
- $5.40 – $5.50: Lower channel support projection toward the right side of the chart.
If the price breaks below the lower boundary of the pattern, the Bull Flag structure could fail, potentially exposing UNI to further downside toward lower support levels.
## 🎯 5. Key Technical Levels to Monitor
| Description | Price |
|---|---:|
| 💰 Current Price | $7.5634 |
| 🔴 Breakout Resistance | ± $7.60–$7.90 |
| 🟢 Short-Term Support | $7.00–$6.80 |
| 🟡 Next Support | ± $6.50 |
| 🎯 Resistance 1 | $8.60 |
| 🎯 Resistance 2 | $9.08 |
| 🎯 Resistance 3 | $9.74 |
| 🚀 Resistance 4 | $10.25 |
| 🏆 Previous High | $10.9459 |
*Note: Breakout and dynamic support levels are approximate estimates based on the trendlines drawn on the chart, not confirmed price levels.*
## 🔥 6. Final Analysis & Outlook
UNI is currently showing an interesting technical structure after experiencing a significant rally followed by a consolidation phase in the form of a descending channel.
The Bull Flag formation presents the potential for bullish continuation if the price successfully breaks above the upper resistance boundary with volume confirmation.
📈 Bullish Outlook: A confirmed breakout above the descending channel could open the door toward $8.60, $9.08, $9.74, and potentially $10.25.
📉 Bearish Outlook: A failed breakout followed by a breakdown below the lower channel support could invalidate the bullish structure and expose UNI to further downside.
👀 For now, the main focus remains on the descending channel resistance. A confirmed breakout could become an important signal for the potential continuation of UNI's bullish momentum.
#UNI #Uniswap #UNIUSDT #Crypto
UNI💱 Pair: UNI/USDT
⏳ Time Frame: 1 Day (1D)
📈 Pattern: Bull Flag (Descending Channel)
💰 Current Price: $7.5634
🎯 Potential Upside Targets: $8.60 – $10.25
📊 Market Bias: Bullish as long as the pattern structure remains intact.
## 🔍 1. Chart Structure Analysis
UNI is currently forming a potential Bull Flag pattern following a significant upward move from approximately $3.00 to a peak of around $10.94.
After this strong rally, the price entered a consolidation phase, forming a descending channel characterized by a series of lower highs and lower lows in the short term.
Interestingly, the current price action suggests that UNI is attempting to maintain support within this pattern.
📌 Key observations from the chart:
- 🚀 Strong Bullish Impulse: UNI previously experienced a significant upward move, forming the flagpole of the Bull Flag pattern.
- 📉 Descending Channel: Following the rally, the price began moving within a downward-sloping channel as part of its consolidation phase.
- 🟢 Potential Accumulation: This consolidation could represent a period of buying absorption before the price attempts to resume its upward trend.
- ⚡ Breakout Potential: If the price successfully breaks above the descending channel resistance, UNI could initiate its next bullish move.
## 📐 2. Understanding the Bull Flag Pattern
A Bull Flag is a bullish continuation pattern that typically develops after a strong upward price movement within a relatively short period.
This pattern consists of two main structures:
🚀 A. Flagpole
The flagpole represents a strong upward price movement before the market enters consolidation.
On the UNI chart, the rally from approximately $3.00 toward $10.94 represents the bullish impulse that forms the flagpole.
📉 B. Flag
After the significant rally, the price begins moving within a descending channel, with resistance gradually sloping downward.
This phase indicates that the market is undergoing consolidation following its previous rally.
⚡ C. Breakout Confirmation
The bullish outlook becomes stronger if the price successfully breaks above the descending channel resistance, accompanied by increasing trading volume and a daily candle close above resistance.
If the breakout is confirmed, the Bull Flag pattern could signal a continuation of the previous upward trend.
## 🟢 3. Bullish Scenario
The bullish scenario becomes increasingly attractive if UNI manages to break out of the descending channel and confirm a breakout above the red resistance trendline.
If buying pressure increases, the following resistance levels are worth monitoring:
| Target | Price Area |
|---|---:|
| 🎯 TP1 | $8.60 |
| 🎯 TP2 | $9.08 |
| 🎯 TP3 | $9.74 |
| 🚀 TP4 | $10.25 |
| 🔥 Previous High | $10.9459 |
Bullish Confirmation:
- 🟢 Price successfully breaks above the descending channel resistance.
- 📈 The daily candle closes above the resistance trendline.
- 📊 Trading volume increases during the breakout.
- 🔄 Price successfully retests and holds the breakout area as new support.
If these confirmations occur, UNI could continue its upward movement and retest the $10.25 resistance area, potentially challenging its previous high of $10.9459.
## 🔴 4. Bearish Scenario
Although the chart structure suggests a potential Bull Flag formation, a bullish breakout is not guaranteed.
UNI still faces the risk of rejection at the descending channel resistance.
Several bearish conditions should be monitored:
- ⚠️ Price fails to break above the red resistance trendline and faces renewed selling pressure.
- 📉 UNI loses bullish momentum and continues trading inside the descending channel.
- 🔻 Price breaks below the lower support boundary of the Bull Flag pattern.
- 🧨 A breakdown accompanied by increasing selling volume could invalidate the bullish scenario.
Key Support Areas to Watch:
- $7.00 – $6.80: Short-term support area.
- $6.50: Next potential support area, depending on the channel structure.
- $5.40 – $5.50: Lower channel support projection toward the right side of the chart.
If the price breaks below the lower boundary of the pattern, the Bull Flag structure could fail, potentially exposing UNI to further downside toward lower support levels.
## 🎯 5. Key Technical Levels to Monitor
| Description | Price |
|---|---:|
| 💰 Current Price | $7.5634 |
| 🔴 Breakout Resistance | ± $7.60–$7.90 |
| 🟢 Short-Term Support | $7.00–$6.80 |
| 🟡 Next Support | ± $6.50 |
| 🎯 Resistance 1 | $8.60 |
| 🎯 Resistance 2 | $9.08 |
| 🎯 Resistance 3 | $9.74 |
| 🚀 Resistance 4 | $10.25 |
| 🏆 Previous High | $10.9459 |
*Note: Breakout and dynamic support levels are approximate estimates based on the trendlines drawn on the chart, not confirmed price levels.*
## 🔥 6. Final Analysis & Outlook
UNI is currently showing an interesting technical structure after experiencing a significant rally followed by a consolidation phase in the form of a descending channel.
The Bull Flag formation presents the potential for bullish continuation if the price successfully breaks above the upper resistance boundary with volume confirmation.
📈 Bullish Outlook: A confirmed breakout above the descending channel could open the door toward $8.60, $9.08, $9.74, and potentially $10.25.
📉 Bearish Outlook: A failed breakout followed by a breakdown below the lower channel support could invalidate the bullish structure and expose UNI to further downside.
👀 For now, the main focus remains on the descending channel resistance. A confirmed breakout could become an important signal for the potential continuation of UNI's bullish momentum.
#UNI #Uniswap #UNIUSDT #Crypto

✅ Get Free Signals! Join Our Telegram Channel Here: t.me/TheCryptoNuclear
✅ Twitter: twitter.com/crypto_nuclear
✅ Join Bybit : partner.bybit.com/b/nuclearvip
✅ Benefits : Lifetime Trading Fee Discount -50%
✅ Twitter: twitter.com/crypto_nuclear
✅ Join Bybit : partner.bybit.com/b/nuclearvip
✅ Benefits : Lifetime Trading Fee Discount -50%
Wyłączenie odpowiedzialności
Informacje i publikacje nie stanowią i nie powinny być traktowane jako porady finansowe, inwestycyjne, tradingowe ani jakiekolwiek inne rekomendacje dostarczane lub zatwierdzone przez TradingView. Więcej informacji znajduje się w Warunkach użytkowania.
✅ Get Free Signals! Join Our Telegram Channel Here: t.me/TheCryptoNuclear
✅ Twitter: twitter.com/crypto_nuclear
✅ Join Bybit : partner.bybit.com/b/nuclearvip
✅ Benefits : Lifetime Trading Fee Discount -50%
✅ Twitter: twitter.com/crypto_nuclear
✅ Join Bybit : partner.bybit.com/b/nuclearvip
✅ Benefits : Lifetime Trading Fee Discount -50%
Wyłączenie odpowiedzialności
Informacje i publikacje nie stanowią i nie powinny być traktowane jako porady finansowe, inwestycyjne, tradingowe ani jakiekolwiek inne rekomendacje dostarczane lub zatwierdzone przez TradingView. Więcej informacji znajduje się w Warunkach użytkowania.