
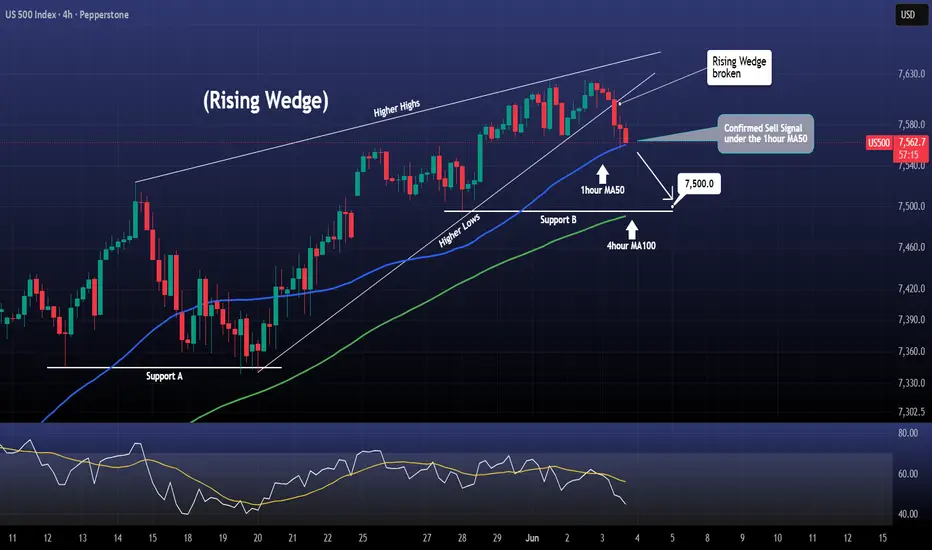
The Sell Signal Is Here. But The Real Test Starts At 7,500
After weeks of persistent higher highs and higher lows, the first meaningful technical crack has finally appeared.
The rising wedge that carried price toward fresh highs has now broken to the downside, and momentum indicators are beginning to confirm the loss of strength.
However, the bigger question is not whether a sell signal appeared.
The bigger question is whether sellers can actually follow through.
Trend Structure
The broader trend remains bullish.
Price continues to trade above the rising 4-hour MA100 and remains above the major support structure around 7,500.
The market has been printing a clear sequence of higher highs and higher lows, which remains intact unless support is decisively broken.
What has changed is short-term momentum.
Support / Resistance
Immediate Support: 7,500
This level is particularly important because it aligns with:
• Support B
• The projected wedge breakdown target
• The rising 4-hour MA100 region
Resistance:
The broken wedge structure now becomes the first resistance zone.
A recovery back inside the wedge would weaken the bearish breakdown signal.
Moving Averages
The chart highlights an important shift.
1-Hour MA50
Price has fallen beneath the 1-hour MA50.
The chart specifically notes this as the first confirmed sell signal.
4-Hour MA100
The longer-term MA100 continues rising beneath price.
This is the key trend filter.
As long as price remains above it, the broader trend remains constructive.
Indicators Visible
RSI has rolled over sharply.
While price was making higher highs inside the wedge, RSI failed to show the same strength.
Momentum is now trending lower and sits well below recent highs.
This confirms weakening buying pressure.
Chart Pattern
Rising Wedge Breakdown
This is the dominant pattern on the chart.
Characteristics:
• Rising resistance line
• Rising support line
• Contracting upside momentum
• Breakdown beneath support
Historically, rising wedges often resolve lower because buying pressure becomes increasingly inefficient as price advances.
The breakdown now shifts attention toward the projected target.
Momentum
Momentum favors sellers in the short term.
The wedge failed.
RSI is weakening.
Price lost the 1-hour MA50.
However, momentum has not yet damaged the larger bullish structure.
That only happens if support begins to fail.
Bullish Scenario
If buyers defend 7,500 and reclaim the broken wedge structure, this breakdown could become a bear trap.
The broader trend remains positive while higher-timeframe support continues holding.
A successful defense would likely attract dip buyers.
Bearish Scenario
If 7,500 breaks, sellers could gain meaningful control of the chart.
The wedge breakdown would then be fully validated.
That would likely trigger increased focus on the 4-hour MA100 as the next major battleground.
Institutional Interpretation
Strong trends rarely end from a single sell signal.
Instead, they usually begin with small structural cracks before larger breakdowns develop.
This wedge break may be the first warning.
Whether it becomes something bigger depends entirely on how price reacts around 7,500.
Key Conclusion
The sell signal has appeared.
The trend has not yet broken.
The market is now approaching the level that determines which side wins this battle.
Discussion Question
Do you think 7,500 becomes another buying opportunity, or is this the beginning of a larger correction?
After weeks of persistent higher highs and higher lows, the first meaningful technical crack has finally appeared.
The rising wedge that carried price toward fresh highs has now broken to the downside, and momentum indicators are beginning to confirm the loss of strength.
However, the bigger question is not whether a sell signal appeared.
The bigger question is whether sellers can actually follow through.
Trend Structure
The broader trend remains bullish.
Price continues to trade above the rising 4-hour MA100 and remains above the major support structure around 7,500.
The market has been printing a clear sequence of higher highs and higher lows, which remains intact unless support is decisively broken.
What has changed is short-term momentum.
Support / Resistance
Immediate Support: 7,500
This level is particularly important because it aligns with:
• Support B
• The projected wedge breakdown target
• The rising 4-hour MA100 region
Resistance:
The broken wedge structure now becomes the first resistance zone.
A recovery back inside the wedge would weaken the bearish breakdown signal.
Moving Averages
The chart highlights an important shift.
1-Hour MA50
Price has fallen beneath the 1-hour MA50.
The chart specifically notes this as the first confirmed sell signal.
4-Hour MA100
The longer-term MA100 continues rising beneath price.
This is the key trend filter.
As long as price remains above it, the broader trend remains constructive.
Indicators Visible
RSI has rolled over sharply.
While price was making higher highs inside the wedge, RSI failed to show the same strength.
Momentum is now trending lower and sits well below recent highs.
This confirms weakening buying pressure.
Chart Pattern
Rising Wedge Breakdown
This is the dominant pattern on the chart.
Characteristics:
• Rising resistance line
• Rising support line
• Contracting upside momentum
• Breakdown beneath support
Historically, rising wedges often resolve lower because buying pressure becomes increasingly inefficient as price advances.
The breakdown now shifts attention toward the projected target.
Momentum
Momentum favors sellers in the short term.
The wedge failed.
RSI is weakening.
Price lost the 1-hour MA50.
However, momentum has not yet damaged the larger bullish structure.
That only happens if support begins to fail.
Bullish Scenario
If buyers defend 7,500 and reclaim the broken wedge structure, this breakdown could become a bear trap.
The broader trend remains positive while higher-timeframe support continues holding.
A successful defense would likely attract dip buyers.
Bearish Scenario
If 7,500 breaks, sellers could gain meaningful control of the chart.
The wedge breakdown would then be fully validated.
That would likely trigger increased focus on the 4-hour MA100 as the next major battleground.
Institutional Interpretation
Strong trends rarely end from a single sell signal.
Instead, they usually begin with small structural cracks before larger breakdowns develop.
This wedge break may be the first warning.
Whether it becomes something bigger depends entirely on how price reacts around 7,500.
Key Conclusion
The sell signal has appeared.
The trend has not yet broken.
The market is now approaching the level that determines which side wins this battle.
Discussion Question
Do you think 7,500 becomes another buying opportunity, or is this the beginning of a larger correction?

thecryptagon.com covers news & insights on global markets (crypto, forex, stocks, commodities)
Institutional services offered:
💰 Daily consulting
💰 Account management
💰 Mentorship
Contact: t.me/thecryptagon | info@thecryptagon.com
Institutional services offered:
💰 Daily consulting
💰 Account management
💰 Mentorship
Contact: t.me/thecryptagon | info@thecryptagon.com
Wyłączenie odpowiedzialności
Informacje i publikacje nie stanowią i nie powinny być traktowane jako porady finansowe, inwestycyjne, tradingowe ani jakiekolwiek inne rekomendacje dostarczane lub zatwierdzone przez TradingView. Więcej informacji znajduje się w Warunkach użytkowania.
thecryptagon.com covers news & insights on global markets (crypto, forex, stocks, commodities)
Institutional services offered:
💰 Daily consulting
💰 Account management
💰 Mentorship
Contact: t.me/thecryptagon | info@thecryptagon.com
Institutional services offered:
💰 Daily consulting
💰 Account management
💰 Mentorship
Contact: t.me/thecryptagon | info@thecryptagon.com
Wyłączenie odpowiedzialności
Informacje i publikacje nie stanowią i nie powinny być traktowane jako porady finansowe, inwestycyjne, tradingowe ani jakiekolwiek inne rekomendacje dostarczane lub zatwierdzone przez TradingView. Więcej informacji znajduje się w Warunkach użytkowania.