

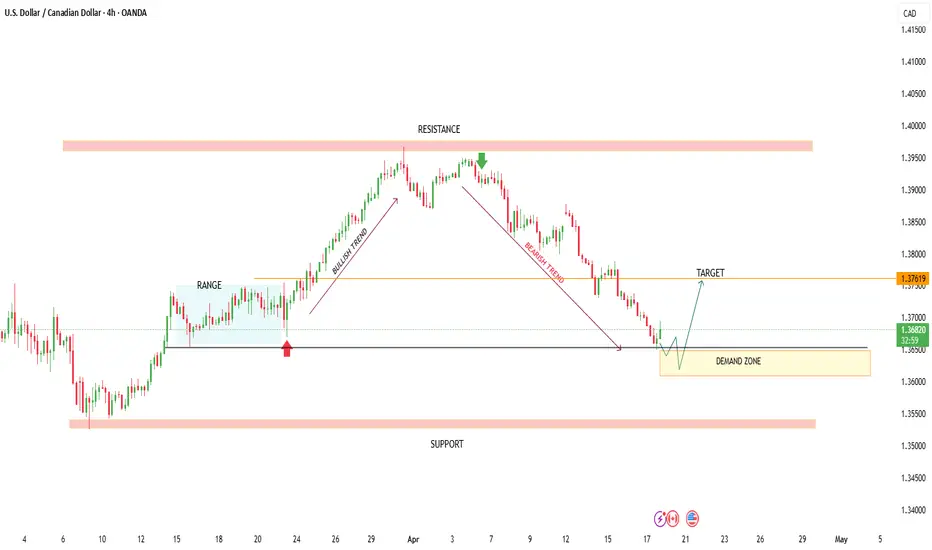
📊 USD/CAD Market Structure Analysis – Bearish Continuation into Demand Zone ⚡
The chart presents a clean market cycle transition from accumulation to distribution, followed by a clear bearish leg. Here's the professional breakdown:
🔍 Market Structure Overview
Price initially moved in a range phase, showing accumulation behavior.
A bullish breakout followed, forming a strong uptrend with higher highs and higher lows 📈
Price reached a major resistance zone, where buying momentum weakened.
🚨 Reversal & Bearish Shift
At resistance, the market formed a distribution structure (multiple rejections).
A clear trend shift occurred → structure broke downward.
The market transitioned into a bearish trend with consistent lower highs and lower lows 📉
🟡 Current Price Location
Price is now approaching a key demand zone (strong historical support).
This area aligns with previous liquidity and reaction points — high probability zone.
🎯 Trade Expectation
Short-term: Possible reaction/bounce from demand zone 🔄
If buyers step in:
Target → 1.3760 zone (previous support turned resistance)
If demand fails:
Expect further downside continuation toward lower support
⚠️ Key Levels
🔴 Resistance: 1.3950 – 1.4000
🟢 Target: 1.3760
🟡 Demand Zone: ~1.3600 – 1.3650
💡 Conclusion
The market is currently bearish overall, but entering a high-probability demand zone. Watch for confirmation (rejection, bullish candles, or structure shift) before considering long positions.
The chart presents a clean market cycle transition from accumulation to distribution, followed by a clear bearish leg. Here's the professional breakdown:
🔍 Market Structure Overview
Price initially moved in a range phase, showing accumulation behavior.
A bullish breakout followed, forming a strong uptrend with higher highs and higher lows 📈
Price reached a major resistance zone, where buying momentum weakened.
🚨 Reversal & Bearish Shift
At resistance, the market formed a distribution structure (multiple rejections).
A clear trend shift occurred → structure broke downward.
The market transitioned into a bearish trend with consistent lower highs and lower lows 📉
🟡 Current Price Location
Price is now approaching a key demand zone (strong historical support).
This area aligns with previous liquidity and reaction points — high probability zone.
🎯 Trade Expectation
Short-term: Possible reaction/bounce from demand zone 🔄
If buyers step in:
Target → 1.3760 zone (previous support turned resistance)
If demand fails:
Expect further downside continuation toward lower support
⚠️ Key Levels
🔴 Resistance: 1.3950 – 1.4000
🟢 Target: 1.3760
🟡 Demand Zone: ~1.3600 – 1.3650
💡 Conclusion
The market is currently bearish overall, but entering a high-probability demand zone. Watch for confirmation (rejection, bullish candles, or structure shift) before considering long positions.
Zlecenie aktywne
Your analysis is playing out well—price respected the bearish structure, tapped the demand zone, and is now moving toward the projected target. Clean and disciplined setup.

✦ MARKET STRATEGY SIGNALS ✦ 📊
Smart Money • Price Action • Precision • good entries
📲 Join Telegram: t.me/marketstrategyentry
Smart Money • Price Action • Precision • good entries
📲 Join Telegram: t.me/marketstrategyentry
Powiązane publikacje
Wyłączenie odpowiedzialności
Informacje i publikacje nie stanowią i nie powinny być traktowane jako porady finansowe, inwestycyjne, tradingowe ani jakiekolwiek inne rekomendacje dostarczane lub zatwierdzone przez TradingView. Więcej informacji znajduje się w Warunkach użytkowania.
✦ MARKET STRATEGY SIGNALS ✦ 📊
Smart Money • Price Action • Precision • good entries
📲 Join Telegram: t.me/marketstrategyentry
Smart Money • Price Action • Precision • good entries
📲 Join Telegram: t.me/marketstrategyentry
Powiązane publikacje
Wyłączenie odpowiedzialności
Informacje i publikacje nie stanowią i nie powinny być traktowane jako porady finansowe, inwestycyjne, tradingowe ani jakiekolwiek inne rekomendacje dostarczane lub zatwierdzone przez TradingView. Więcej informacji znajduje się w Warunkach użytkowania.