

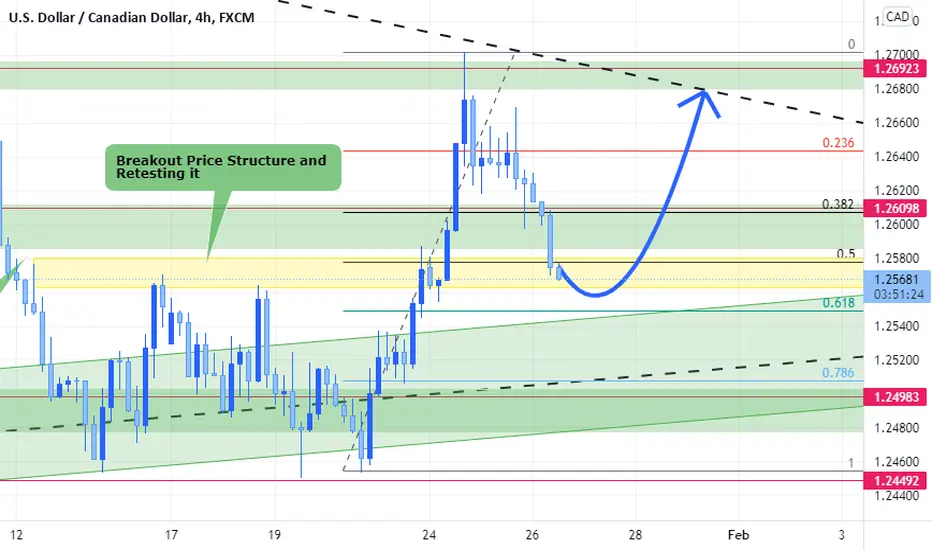
This pair is going bullish for now
Technical Analysis
1-Break out price structure and retesting it before continuation to the upside
2-Ascending Triangle Chart Pattern on weekly Time Frame
*Sentimental Analysis:
1-CADJPY Reached falling resistance level indicating bearish move for the pair (Indicating possible weakness for the CAD)

2-AUDCAD is making Q&M chart Pattern which is indication of bullish move for the pair(Indicating possible weakness for the CAD)

Technical Analysis
1-Break out price structure and retesting it before continuation to the upside
2-Ascending Triangle Chart Pattern on weekly Time Frame
*Sentimental Analysis:
1-CADJPY Reached falling resistance level indicating bearish move for the pair (Indicating possible weakness for the CAD)
2-AUDCAD is making Q&M chart Pattern which is indication of bullish move for the pair(Indicating possible weakness for the CAD)
Transakcja zamknięta: osiągnięto wyznaczony cel

Wyłączenie odpowiedzialności
Informacje i publikacje nie stanowią i nie powinny być traktowane jako porady finansowe, inwestycyjne, tradingowe ani jakiekolwiek inne rekomendacje dostarczane lub zatwierdzone przez TradingView. Więcej informacji znajduje się w Warunkach użytkowania.
Wyłączenie odpowiedzialności
Informacje i publikacje nie stanowią i nie powinny być traktowane jako porady finansowe, inwestycyjne, tradingowe ani jakiekolwiek inne rekomendacje dostarczane lub zatwierdzone przez TradingView. Więcej informacji znajduje się w Warunkach użytkowania.