

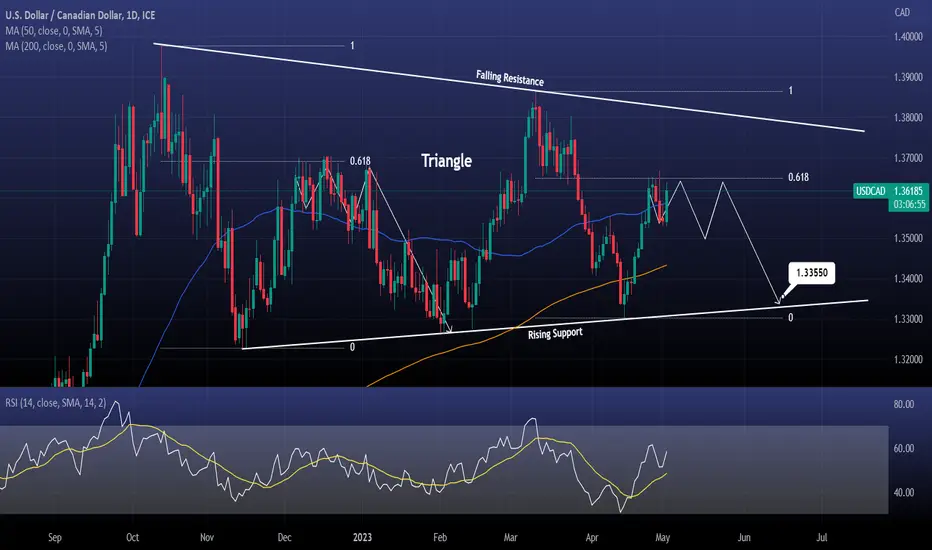
USDCAD is trading inside a Triangle with the price rising after it last hit the pattern's bottom (Rising Support).
It has failed to close over Fibonacci 0.618 on six straight days.
This failure is a technical sign of trend weakness, very much alike the struggle on Fibonacci 0.618 last December.
Sell and target the Rising Support again at 1.33550.
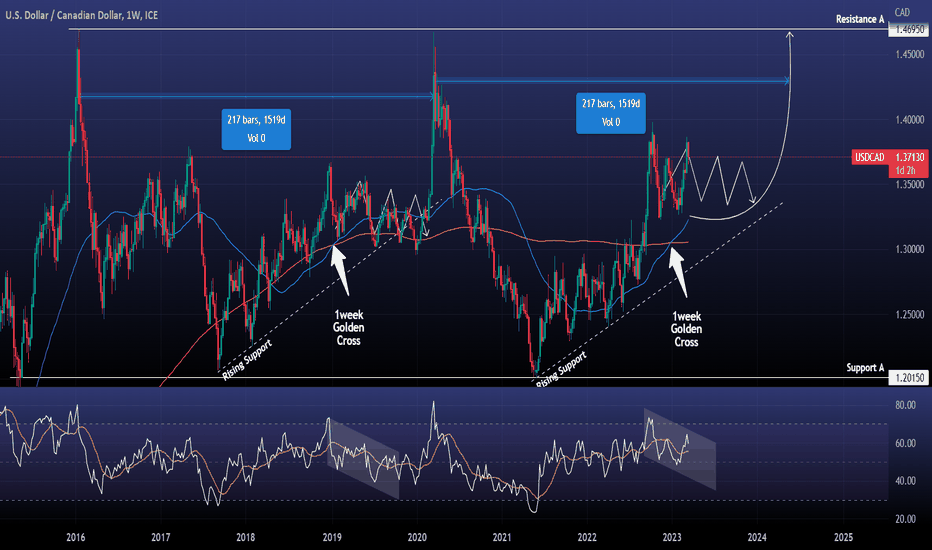
Previous chart:
Follow us, like the idea and leave a comment below!!
It has failed to close over Fibonacci 0.618 on six straight days.
This failure is a technical sign of trend weakness, very much alike the struggle on Fibonacci 0.618 last December.
Sell and target the Rising Support again at 1.33550.
Previous chart:
Follow us, like the idea and leave a comment below!!

thecryptagon.com covers news & insights on global markets (crypto, forex, stocks, commodities)
Institutional services offered:
💰 Daily consulting
💰 Account management
💰 Mentorship
Contact: t.me/thecryptagon | info@thecryptagon.com
Institutional services offered:
💰 Daily consulting
💰 Account management
💰 Mentorship
Contact: t.me/thecryptagon | info@thecryptagon.com
Wyłączenie odpowiedzialności
Informacje i publikacje nie stanowią i nie powinny być traktowane jako porady finansowe, inwestycyjne, tradingowe ani jakiekolwiek inne rekomendacje dostarczane lub zatwierdzone przez TradingView. Więcej informacji znajduje się w Warunkach użytkowania.
thecryptagon.com covers news & insights on global markets (crypto, forex, stocks, commodities)
Institutional services offered:
💰 Daily consulting
💰 Account management
💰 Mentorship
Contact: t.me/thecryptagon | info@thecryptagon.com
Institutional services offered:
💰 Daily consulting
💰 Account management
💰 Mentorship
Contact: t.me/thecryptagon | info@thecryptagon.com
Wyłączenie odpowiedzialności
Informacje i publikacje nie stanowią i nie powinny być traktowane jako porady finansowe, inwestycyjne, tradingowe ani jakiekolwiek inne rekomendacje dostarczane lub zatwierdzone przez TradingView. Więcej informacji znajduje się w Warunkach użytkowania.