

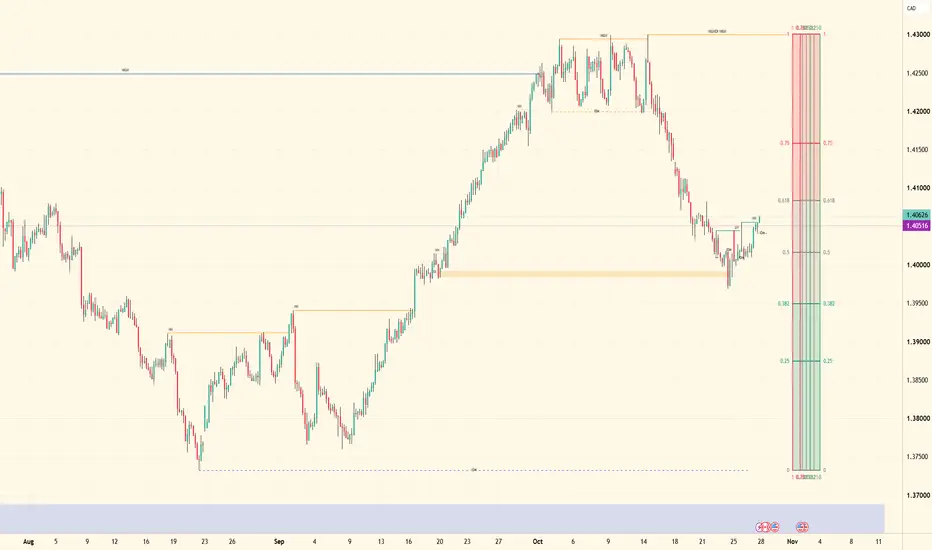
Top-down analysis is leaning bullish after price manipulated the highs, delivered distribution, and confirmed the high before taking the internal inducement leg.
Price delivered beneath the mapped structure and into sub-equilibrium, approaching discounted territory. Buyers responded with bullish displacement, highlighting the orange zone as a potential area of interest.
From there, price produced a lower-timeframe market structure shift by breaking the external lower high, followed by the formation of a new lower-timeframe higher high. The immediate structure is now leaning bullish.
The next piece is timing. I’m waiting for bearish pullback to develop and provide the corrective distribution needed for a potential continuation.
My focus is on the internal leg: a lower-timeframe inducement sweep to confirm the minor high, followed by delivery into the lower-timeframe minor auction zone.
Once that zone is mitigated, I’ll drop down for a candle-range shift before establishing a potential buy point, with the midterm highs as the objective.
Until the sequence lines up, no forcing and no chasing.
Patience is key. Tracking remains the edge. Let’s go. 🥤

Wyłączenie odpowiedzialności
Informacje i publikacje nie stanowią i nie powinny być traktowane jako porady finansowe, inwestycyjne, tradingowe ani jakiekolwiek inne rekomendacje dostarczane lub zatwierdzone przez TradingView. Więcej informacji znajduje się w Warunkach użytkowania.
Wyłączenie odpowiedzialności
Informacje i publikacje nie stanowią i nie powinny być traktowane jako porady finansowe, inwestycyjne, tradingowe ani jakiekolwiek inne rekomendacje dostarczane lub zatwierdzone przez TradingView. Więcej informacji znajduje się w Warunkach użytkowania.