

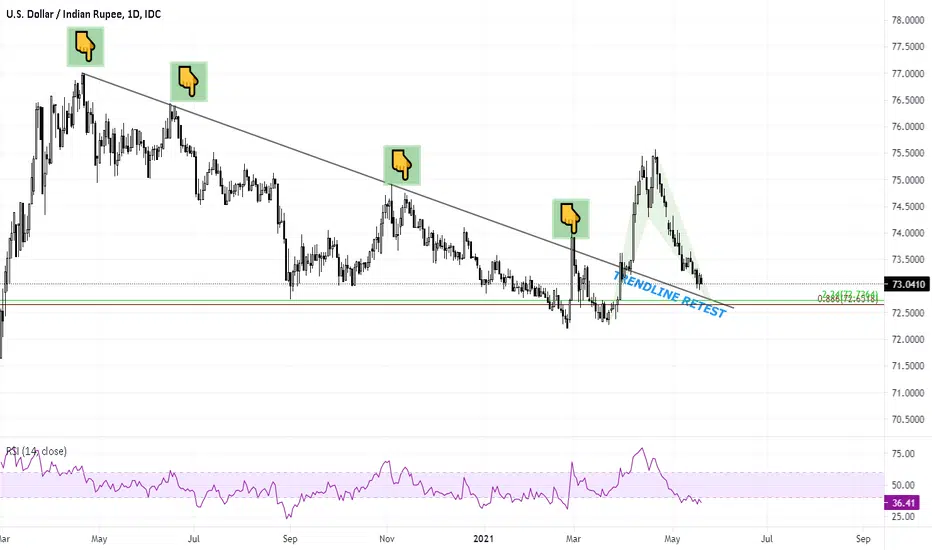
The current structure of USDINR is still weak and is probably moving towards 72.65 levels.
The current chart shows two technical possibilities that suggest goos support zone in the 72-73 range.
At First, there is trendline support, that the prices broke in April 2021, and the same trendline would now act as a support.
Secondly, there is also a harmonic pattern probability whose support also coincides with the trendline support.
So keep your eyes on price action, and be ready to take advantage of solid support.
If you are trading this, you are trading at your own risk
The current chart shows two technical possibilities that suggest goos support zone in the 72-73 range.
At First, there is trendline support, that the prices broke in April 2021, and the same trendline would now act as a support.
Secondly, there is also a harmonic pattern probability whose support also coincides with the trendline support.
So keep your eyes on price action, and be ready to take advantage of solid support.
If you are trading this, you are trading at your own risk

Wyłączenie odpowiedzialności
Informacje i publikacje nie stanowią i nie powinny być traktowane jako porady finansowe, inwestycyjne, tradingowe ani jakiekolwiek inne rekomendacje dostarczane lub zatwierdzone przez TradingView. Więcej informacji znajduje się w Warunkach użytkowania.
Wyłączenie odpowiedzialności
Informacje i publikacje nie stanowią i nie powinny być traktowane jako porady finansowe, inwestycyjne, tradingowe ani jakiekolwiek inne rekomendacje dostarczane lub zatwierdzone przez TradingView. Więcej informacji znajduje się w Warunkach użytkowania.