

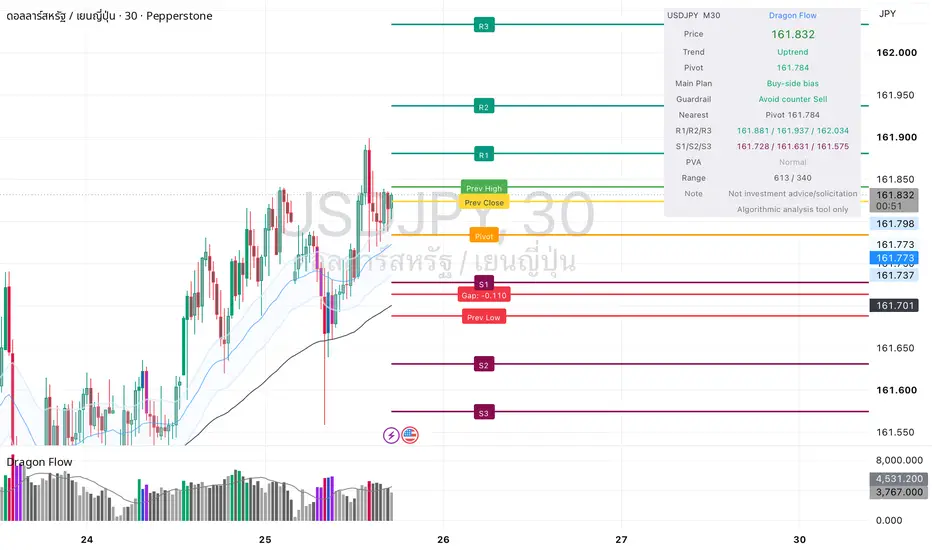
USDJPY M30 Chart Analysis
Overall bias: Bullish / Buy-side bias
The Dragon Flow panel shows:
Item Reading
Price 161.821
Trend Uptrend
Pivot 161.784
Main Plan Buy-side bias
Guardrail Avoid counter Sell
Price is currently above Pivot 161.784, and the short-term structure is still bullish. This is a cleaner buy-side setup than EURUSD.
⸻
Market Structure
USDJPY has been forming higher highs and higher lows on M30. There was a sharp liquidity sweep down near 161.55–161.60, followed by a strong recovery. That tells us buyers defended the lower zone aggressively.
Observation Meaning
Price above Pivot Buyers still have control
Price above moving averages Bullish momentum remains active
Recent strong recovery from wick low Demand appeared near lower support
Price now near R1 Do not chase blindly
The trend is bullish, but current price is already close to resistance, so the best entries are either pullback buys or breakout-retest buys.
⸻
Key Resistance Levels
Level Meaning
161.881 R1 / immediate upside target
161.937 R2
162.034 R3 / major short-term target
The nearest resistance is 161.881. Price needs to break and hold above this level to continue cleanly toward 161.937–162.034.
⸻
Key Support Levels
Level Meaning
161.784 Pivot / main intraday support
161.728 S1
161.700–161.728 Gap / support zone
161.631 S2
161.575 S3
The most important buy zone is:
161.728–161.784
If price pulls back into this area and rejects, it gives a cleaner buy setup.
⸻
Trading Plan
Plan A: Buy Pullback
Best buy zone:
161.728–161.784
Buy confirmation:
* Bullish rejection candle
* Long lower wick
* Bullish engulfing
* M30 candle closes back above 161.784
* Price holds above the moving averages
Targets:
Target Level
TP1 161.881
TP2 161.937
TP3 162.034
Stop-loss idea:
* Conservative SL: below 161.728
* Wider SL: below 161.631
⸻
Plan B: Breakout Buy
If price breaks above 161.881:
1. Wait for a retest of 161.881
2. If price holds above it, look for buy continuation
3. Target 161.937
4. Next target 162.034
This is better than buying directly into resistance.
⸻
When Bullish Bias Becomes Invalid
The buy-side view weakens if:
1. Price closes M30 below 161.784
2. Price breaks below 161.728
3. Price loses 161.631
If price breaks below 161.631, the bullish structure is damaged and USDJPY may rotate lower toward 161.575 or below.
⸻
Straight Conclusion
USDJPY M30 is currently bullish.
Best plan:
* Buy zone: 161.728–161.784
* Breakout buy: Above 161.881, then retest hold
* Main targets: 161.881 → 161.937 → 162.034
* Avoid counter-trend sells unless price breaks below Pivot and S1 clearly
Current view: Bullish continuation, but avoid chasing directly under R1. Wait for pullback or confirmed breakout.
Overall bias: Bullish / Buy-side bias
The Dragon Flow panel shows:
Item Reading
Price 161.821
Trend Uptrend
Pivot 161.784
Main Plan Buy-side bias
Guardrail Avoid counter Sell
Price is currently above Pivot 161.784, and the short-term structure is still bullish. This is a cleaner buy-side setup than EURUSD.
⸻
Market Structure
USDJPY has been forming higher highs and higher lows on M30. There was a sharp liquidity sweep down near 161.55–161.60, followed by a strong recovery. That tells us buyers defended the lower zone aggressively.
Observation Meaning
Price above Pivot Buyers still have control
Price above moving averages Bullish momentum remains active
Recent strong recovery from wick low Demand appeared near lower support
Price now near R1 Do not chase blindly
The trend is bullish, but current price is already close to resistance, so the best entries are either pullback buys or breakout-retest buys.
⸻
Key Resistance Levels
Level Meaning
161.881 R1 / immediate upside target
161.937 R2
162.034 R3 / major short-term target
The nearest resistance is 161.881. Price needs to break and hold above this level to continue cleanly toward 161.937–162.034.
⸻
Key Support Levels
Level Meaning
161.784 Pivot / main intraday support
161.728 S1
161.700–161.728 Gap / support zone
161.631 S2
161.575 S3
The most important buy zone is:
161.728–161.784
If price pulls back into this area and rejects, it gives a cleaner buy setup.
⸻
Trading Plan
Plan A: Buy Pullback
Best buy zone:
161.728–161.784
Buy confirmation:
* Bullish rejection candle
* Long lower wick
* Bullish engulfing
* M30 candle closes back above 161.784
* Price holds above the moving averages
Targets:
Target Level
TP1 161.881
TP2 161.937
TP3 162.034
Stop-loss idea:
* Conservative SL: below 161.728
* Wider SL: below 161.631
⸻
Plan B: Breakout Buy
If price breaks above 161.881:
1. Wait for a retest of 161.881
2. If price holds above it, look for buy continuation
3. Target 161.937
4. Next target 162.034
This is better than buying directly into resistance.
⸻
When Bullish Bias Becomes Invalid
The buy-side view weakens if:
1. Price closes M30 below 161.784
2. Price breaks below 161.728
3. Price loses 161.631
If price breaks below 161.631, the bullish structure is damaged and USDJPY may rotate lower toward 161.575 or below.
⸻
Straight Conclusion
USDJPY M30 is currently bullish.
Best plan:
* Buy zone: 161.728–161.784
* Breakout buy: Above 161.881, then retest hold
* Main targets: 161.881 → 161.937 → 162.034
* Avoid counter-trend sells unless price breaks below Pivot and S1 clearly
Current view: Bullish continuation, but avoid chasing directly under R1. Wait for pullback or confirmed breakout.

More charts, notes, and trading updates: @mmxmtrading_999 on X
Wyłączenie odpowiedzialności
Informacje i publikacje nie stanowią i nie powinny być traktowane jako porady finansowe, inwestycyjne, tradingowe ani jakiekolwiek inne rekomendacje dostarczane lub zatwierdzone przez TradingView. Więcej informacji znajduje się w Warunkach użytkowania.
More charts, notes, and trading updates: @mmxmtrading_999 on X
Wyłączenie odpowiedzialności
Informacje i publikacje nie stanowią i nie powinny być traktowane jako porady finansowe, inwestycyjne, tradingowe ani jakiekolwiek inne rekomendacje dostarczane lub zatwierdzone przez TradingView. Więcej informacji znajduje się w Warunkach użytkowania.