

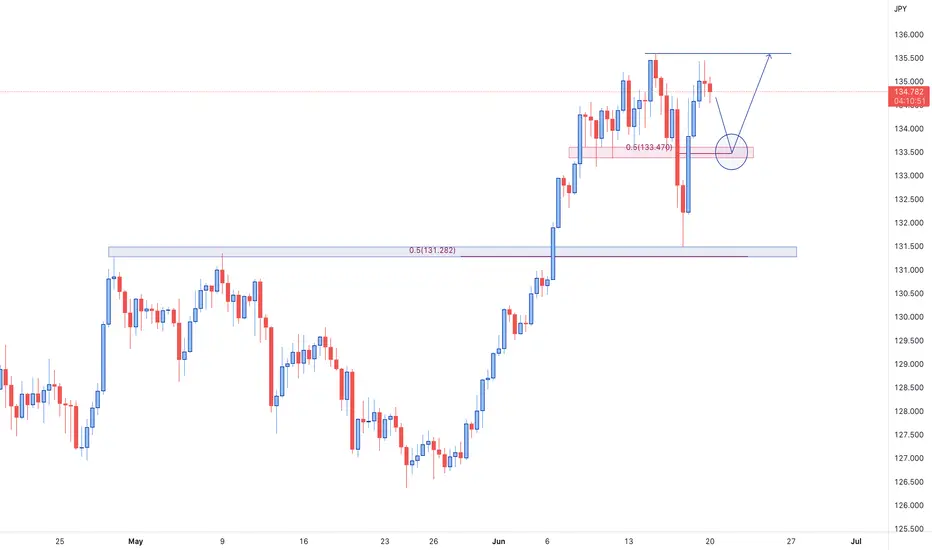
As it can be inferred from higher timeframe graphics, the price has completed the correctional move and rejected the 131.3 area of previous resistance later turned to support that lines up with 50% Fibonacci retracement level.
Looking at the current on lower timeframes, it can be observed that the price has lost some of its bullish power and it needs some corrections before continuing its push to the upside. We are eyeing the zone of support illustrated on the chart that aligns with 0.5 Fibonacci retracement level. From there, we will be looking forward to entering long positions and aiming for the area of resistance plotted on the graph. However, as our long-term sentiment on this security remains bullish, we are pretty positive that the price will keep rising even beyond our initial target.
Happy trading, everyone!
Looking at the current on lower timeframes, it can be observed that the price has lost some of its bullish power and it needs some corrections before continuing its push to the upside. We are eyeing the zone of support illustrated on the chart that aligns with 0.5 Fibonacci retracement level. From there, we will be looking forward to entering long positions and aiming for the area of resistance plotted on the graph. However, as our long-term sentiment on this security remains bullish, we are pretty positive that the price will keep rising even beyond our initial target.
Happy trading, everyone!

Wyłączenie odpowiedzialności
Informacje i publikacje nie stanowią i nie powinny być traktowane jako porady finansowe, inwestycyjne, tradingowe ani jakiekolwiek inne rekomendacje dostarczane lub zatwierdzone przez TradingView. Więcej informacji znajduje się w Warunkach użytkowania.
Wyłączenie odpowiedzialności
Informacje i publikacje nie stanowią i nie powinny być traktowane jako porady finansowe, inwestycyjne, tradingowe ani jakiekolwiek inne rekomendacje dostarczane lub zatwierdzone przez TradingView. Więcej informacji znajduje się w Warunkach użytkowania.