

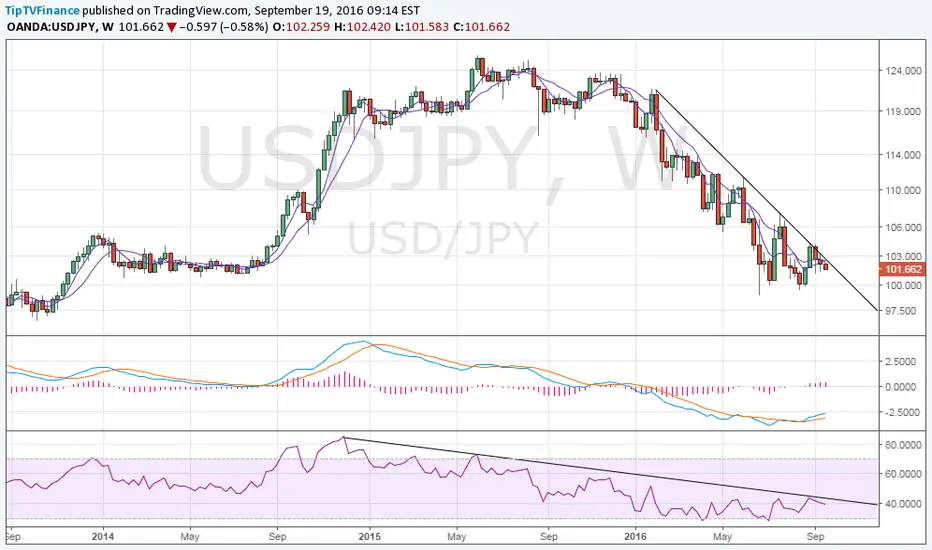
Weekly chart shows the descending trend line on the price chart and RSI is very much intact.
However, note the repeated rebound from near 99-100 levels and the bullish crossover between MACD lines.
Hence, the odds of the pair breaching the descending trendline are high and a much safer short trade would be below 100.00 levels.
However, note the repeated rebound from near 99-100 levels and the bullish crossover between MACD lines.
Hence, the odds of the pair breaching the descending trendline are high and a much safer short trade would be below 100.00 levels.

Powiązane publikacje
Wyłączenie odpowiedzialności
Informacje i publikacje nie stanowią i nie powinny być traktowane jako porady finansowe, inwestycyjne, tradingowe ani jakiekolwiek inne rekomendacje dostarczane lub zatwierdzone przez TradingView. Więcej informacji znajduje się w Warunkach użytkowania.
Powiązane publikacje
Wyłączenie odpowiedzialności
Informacje i publikacje nie stanowią i nie powinny być traktowane jako porady finansowe, inwestycyjne, tradingowe ani jakiekolwiek inne rekomendacje dostarczane lub zatwierdzone przez TradingView. Więcej informacji znajduje się w Warunkach użytkowania.