

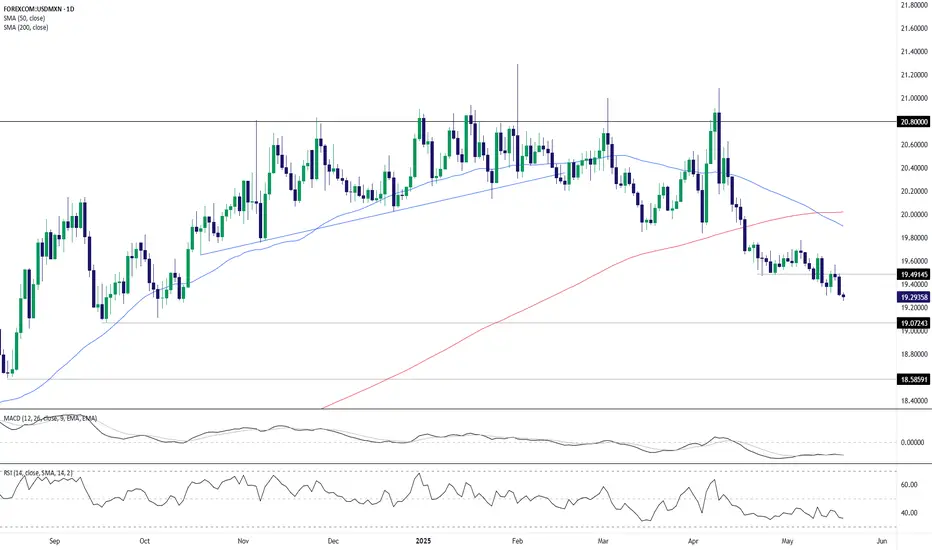
The USD/MXN daily chart is displaying signs of continued weakness:
Downtrend Intact: The pair trades firmly below its 50-day and 200-day moving averages, reinforcing bearish control.
MACD Bearish: Momentum remains to the downside with the MACD line below zero and the signal line.
Key Support Zones: Price is approaching horizontal support at 19.07; a break could expose 18.58 as the next downside target.
Resistance to Watch: Former support near 19.49 now acts as initial resistance.
RSI Holding Lower: The RSI is drifting below 40, showing bearish momentum without reaching oversold territory.
If the pair closes below 19.07, it may accelerate the bearish trend toward the 18.58 handle.
-MW
Downtrend Intact: The pair trades firmly below its 50-day and 200-day moving averages, reinforcing bearish control.
MACD Bearish: Momentum remains to the downside with the MACD line below zero and the signal line.
Key Support Zones: Price is approaching horizontal support at 19.07; a break could expose 18.58 as the next downside target.
Resistance to Watch: Former support near 19.49 now acts as initial resistance.
RSI Holding Lower: The RSI is drifting below 40, showing bearish momentum without reaching oversold territory.
If the pair closes below 19.07, it may accelerate the bearish trend toward the 18.58 handle.
-MW

Wyłączenie odpowiedzialności
Informacje i publikacje nie stanowią i nie powinny być traktowane jako porady finansowe, inwestycyjne, tradingowe ani jakiekolwiek inne rekomendacje dostarczane lub zatwierdzone przez TradingView. Więcej informacji znajduje się w Warunkach użytkowania.
Wyłączenie odpowiedzialności
Informacje i publikacje nie stanowią i nie powinny być traktowane jako porady finansowe, inwestycyjne, tradingowe ani jakiekolwiek inne rekomendacje dostarczane lub zatwierdzone przez TradingView. Więcej informacji znajduje się w Warunkach użytkowania.