
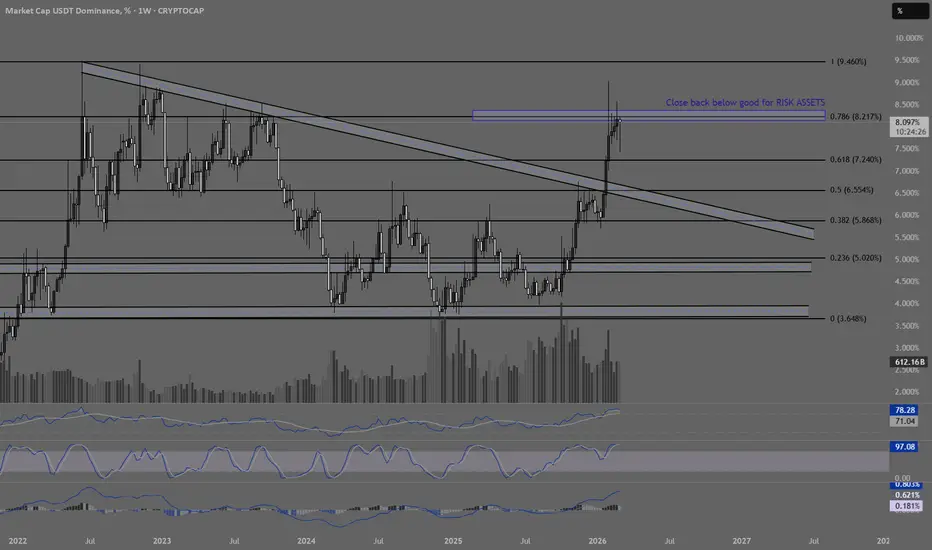
USDT Dominance (USDT.D) pushed into the 0.786 Fibonacci resistance zone (~8.2%) after breaking the long-term descending trendline.
This remains a high-timeframe confluence area, previous reactions, structural resistance, and a macro decision level for risk assets.
Over the past weeks we’ve now seen multiple rejections from this zone, including a large upper wick, suggesting that dominance attempted to move higher but failed to establish acceptance above the resistance box.
Momentum indicators are also starting to roll over on the weekly timeframe, with RSI flattening and Stoch RSI turning down from elevated levels.
This suggests that stablecoin dominance may be losing momentum after the recent spike.
If USDT.D continues rejecting this resistance area and starts moving lower:
→ Downside continuation becomes likely – potentially toward 7.2% → 6.5%
→ Stablecoin inflow momentum slows
→ Liquidity rotates back into risk assets
→ BTC and altcoins could see constructive upside continuation
→ Potential tailwind for crypto over the coming weeks
However,
If dominance manages to reclaim this resistance zone and confirm acceptance above it:
→ Liquidity remains parked in stablecoins
→ Defensive positioning strengthens
→ Risk-off pressure increases
→ BTC likely remains corrective or capped
For now the chart still shows repeated rejection at a key macro resistance level, keeping the risk-on scenario on the table.
This area remains a major decision zone for crypto markets.
This remains a high-timeframe confluence area, previous reactions, structural resistance, and a macro decision level for risk assets.
Over the past weeks we’ve now seen multiple rejections from this zone, including a large upper wick, suggesting that dominance attempted to move higher but failed to establish acceptance above the resistance box.
Momentum indicators are also starting to roll over on the weekly timeframe, with RSI flattening and Stoch RSI turning down from elevated levels.
This suggests that stablecoin dominance may be losing momentum after the recent spike.
If USDT.D continues rejecting this resistance area and starts moving lower:
→ Downside continuation becomes likely – potentially toward 7.2% → 6.5%
→ Stablecoin inflow momentum slows
→ Liquidity rotates back into risk assets
→ BTC and altcoins could see constructive upside continuation
→ Potential tailwind for crypto over the coming weeks
However,
If dominance manages to reclaim this resistance zone and confirm acceptance above it:
→ Liquidity remains parked in stablecoins
→ Defensive positioning strengthens
→ Risk-off pressure increases
→ BTC likely remains corrective or capped
For now the chart still shows repeated rejection at a key macro resistance level, keeping the risk-on scenario on the table.
This area remains a major decision zone for crypto markets.

Wyłączenie odpowiedzialności
Informacje i publikacje nie stanowią i nie powinny być traktowane jako porady finansowe, inwestycyjne, tradingowe ani jakiekolwiek inne rekomendacje dostarczane lub zatwierdzone przez TradingView. Więcej informacji znajduje się w Warunkach użytkowania.
Wyłączenie odpowiedzialności
Informacje i publikacje nie stanowią i nie powinny być traktowane jako porady finansowe, inwestycyjne, tradingowe ani jakiekolwiek inne rekomendacje dostarczane lub zatwierdzone przez TradingView. Więcej informacji znajduje się w Warunkach użytkowania.