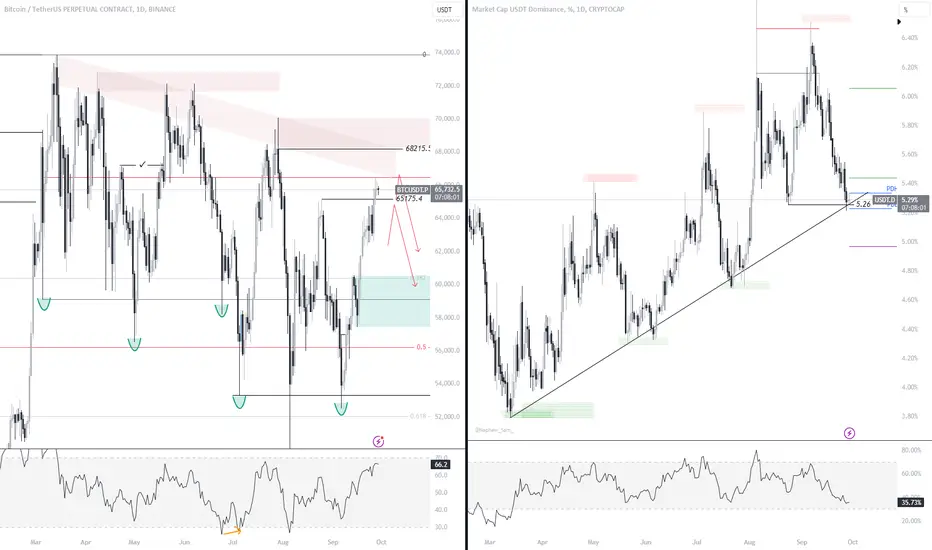
One compelling metric to help make decisions when buying or selling crypto assets is the  USDT.D chart (Dominance of USDT over other assets). Accordingly, the higher the indicator, the more money flows into USDT from other crypto assets.
Looking at the two graphs, it's hard not to notice a simple pattern: the higher BTC, the lower USDT.D, and vice versa.
USDT.D is currently testing the important level of 5.26%. Accordingly, money will now be transferred from crypto assets to $USDT.
This is a +1 factor, and it's time for aBTC correction.
If you like the content, become a ❤️ and invite your friends.
USDT.D chart (Dominance of USDT over other assets). Accordingly, the higher the indicator, the more money flows into USDT from other crypto assets.Looking at the two graphs, it's hard not to notice a simple pattern: the higher
BTC, the lower USDT.D, and vice versa.USDT.D is currently testing the important level of 5.26%. Accordingly, money will now be transferred from crypto assets to $USDT.This is a +1 factor, and it's time for a
BTC correction.If you like the content, become a ❤️ and invite your friends.

Powiązane publikacje
Wyłączenie odpowiedzialności
Informacje i publikacje nie stanowią i nie powinny być traktowane jako porady finansowe, inwestycyjne, tradingowe ani jakiekolwiek inne rekomendacje dostarczane lub zatwierdzone przez TradingView. Więcej informacji znajduje się w Warunkach użytkowania.
Powiązane publikacje
Wyłączenie odpowiedzialności
Informacje i publikacje nie stanowią i nie powinny być traktowane jako porady finansowe, inwestycyjne, tradingowe ani jakiekolwiek inne rekomendacje dostarczane lub zatwierdzone przez TradingView. Więcej informacji znajduje się w Warunkach użytkowania.