

Market Outlook
The US Dollar Index (DXY) opened lower, putting pressure on the US Dollar and leading USDTHB to trade sideways with a bearish bias in the short term. Market participants are closely watching the release of the US Leading Economic Index (LEI) for June, which will provide further insight into the outlook for the US economy. A stronger-than-expected reading could support the US Dollar. With a relatively light US economic calendar today, USD price action is expected to be driven primarily by US Treasury yields, DXY movements, and overall global market sentiment.
Technical Analysis
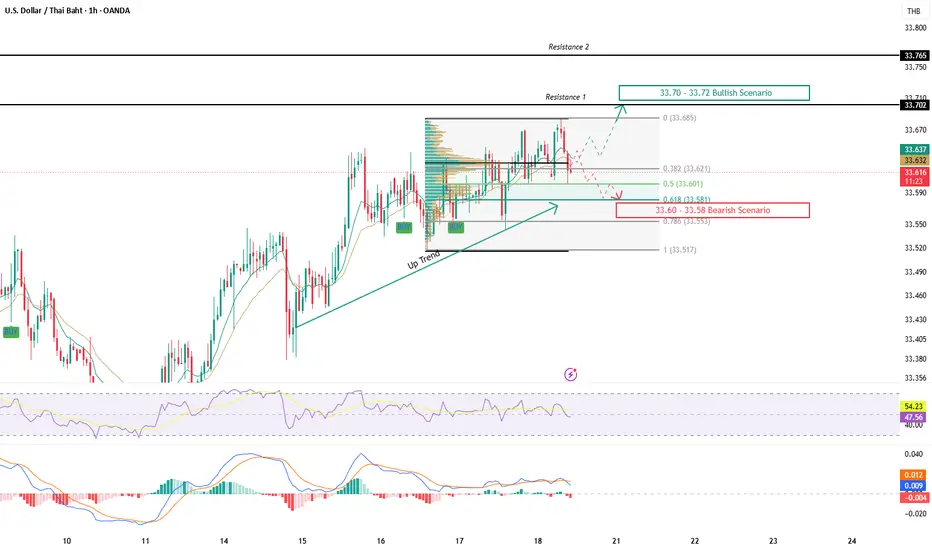
The overall trend for USDTHB remains bullish, as the pair continues to maintain its Higher Low market structure. Although price is currently consolidating within a narrow range, the broader uptrend remains intact. The pair is trading above the 38.2% Fibonacci retracement (33.621) and near the 50.0% Fibonacci level (33.601). If price can reclaim the 33.64–33.65 resistance zone and break above the recent Swing High, it would confirm renewed buying momentum and increase the probability of a move toward the 33.70–33.72 resistance area under the bullish scenario.
Risk Factors
Despite the bullish outlook, 33.66 remains a key short-term resistance level. Failure to break above this area could trigger profit-taking, leading to a pullback toward the 33.60–33.58 support zone. A decisive break below 33.58 would weaken bullish momentum and increase the likelihood of a deeper correction toward 33.55. In addition, a positive opening in the Thai stock market this morning could support the Thai Baht and put downward pressure on USDTHB.
Target Price:
33.70 – 33.72
Support:
33.60 – 33.58
Cut Loss:
33.57
The US Dollar Index (DXY) opened lower, putting pressure on the US Dollar and leading USDTHB to trade sideways with a bearish bias in the short term. Market participants are closely watching the release of the US Leading Economic Index (LEI) for June, which will provide further insight into the outlook for the US economy. A stronger-than-expected reading could support the US Dollar. With a relatively light US economic calendar today, USD price action is expected to be driven primarily by US Treasury yields, DXY movements, and overall global market sentiment.
Technical Analysis
The overall trend for USDTHB remains bullish, as the pair continues to maintain its Higher Low market structure. Although price is currently consolidating within a narrow range, the broader uptrend remains intact. The pair is trading above the 38.2% Fibonacci retracement (33.621) and near the 50.0% Fibonacci level (33.601). If price can reclaim the 33.64–33.65 resistance zone and break above the recent Swing High, it would confirm renewed buying momentum and increase the probability of a move toward the 33.70–33.72 resistance area under the bullish scenario.
Risk Factors
Despite the bullish outlook, 33.66 remains a key short-term resistance level. Failure to break above this area could trigger profit-taking, leading to a pullback toward the 33.60–33.58 support zone. A decisive break below 33.58 would weaken bullish momentum and increase the likelihood of a deeper correction toward 33.55. In addition, a positive opening in the Thai stock market this morning could support the Thai Baht and put downward pressure on USDTHB.
Target Price:
33.70 – 33.72
Support:
33.60 – 33.58
Cut Loss:
33.57

Wyłączenie odpowiedzialności
Informacje i publikacje nie stanowią i nie powinny być traktowane jako porady finansowe, inwestycyjne, tradingowe ani jakiekolwiek inne rekomendacje dostarczane lub zatwierdzone przez TradingView. Więcej informacji znajduje się w Warunkach użytkowania.
Wyłączenie odpowiedzialności
Informacje i publikacje nie stanowią i nie powinny być traktowane jako porady finansowe, inwestycyjne, tradingowe ani jakiekolwiek inne rekomendacje dostarczane lub zatwierdzone przez TradingView. Więcej informacji znajduje się w Warunkach użytkowania.