

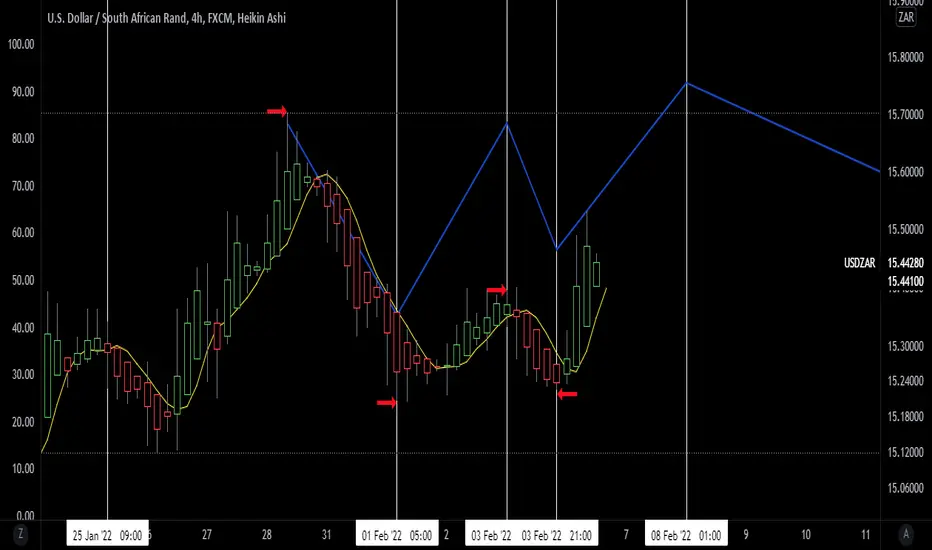
This is a test chart for my modified predictive indicator.
The red arrows are stops.
High and Low points can occur on the white vertical line (Daily Swing Prediction line) or within three candles on either side of a white vertical line
The trade is entered when a candle crosses the White vertical line (Daily Swing Prediction line) and there is a change in candle color. After the candle color change the first candle to be completely captured by the 4 MA is the trade entry candle.
The trade is exited when a candle crosses the White vertical line (Daily Swing Prediction line) and there is a change in candle color. After the color change the first candle to be completely captured by the 4 MA is the trade exit candle.
The red arrows are stops.
High and Low points can occur on the white vertical line (Daily Swing Prediction line) or within three candles on either side of a white vertical line
The trade is entered when a candle crosses the White vertical line (Daily Swing Prediction line) and there is a change in candle color. After the candle color change the first candle to be completely captured by the 4 MA is the trade entry candle.
The trade is exited when a candle crosses the White vertical line (Daily Swing Prediction line) and there is a change in candle color. After the color change the first candle to be completely captured by the 4 MA is the trade exit candle.

Wyłączenie odpowiedzialności
Informacje i publikacje nie stanowią i nie powinny być traktowane jako porady finansowe, inwestycyjne, tradingowe ani jakiekolwiek inne rekomendacje dostarczane lub zatwierdzone przez TradingView. Więcej informacji znajduje się w Warunkach użytkowania.
Wyłączenie odpowiedzialności
Informacje i publikacje nie stanowią i nie powinny być traktowane jako porady finansowe, inwestycyjne, tradingowe ani jakiekolwiek inne rekomendacje dostarczane lub zatwierdzone przez TradingView. Więcej informacji znajduje się w Warunkach użytkowania.