
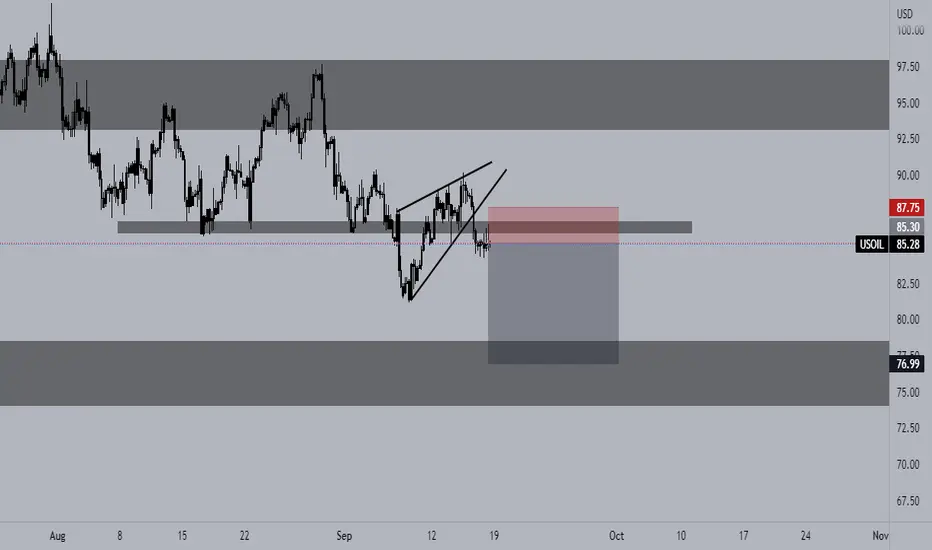
From the W1 timeframe, we can see a double top pattern that successfully broken the neckline confirming bearish pressure. Also, last weeks WI candle closed bearish confirming sell momentum.
On the D1, we can clearly see that price pulled back after what looked like a head and shoulders pattern and after failing to break the neckline slumped back below support. This also indicates strong bearish momentum.
Finally on my entry timeframe the H4, we see the ascending wedge which broke and came back to support to resistance before heading lower.

Wyłączenie odpowiedzialności
Informacje i publikacje nie stanowią i nie powinny być traktowane jako porady finansowe, inwestycyjne, tradingowe ani jakiekolwiek inne rekomendacje dostarczane lub zatwierdzone przez TradingView. Więcej informacji znajduje się w Warunkach użytkowania.
Wyłączenie odpowiedzialności
Informacje i publikacje nie stanowią i nie powinny być traktowane jako porady finansowe, inwestycyjne, tradingowe ani jakiekolwiek inne rekomendacje dostarczane lub zatwierdzone przez TradingView. Więcej informacji znajduje się w Warunkach użytkowania.