
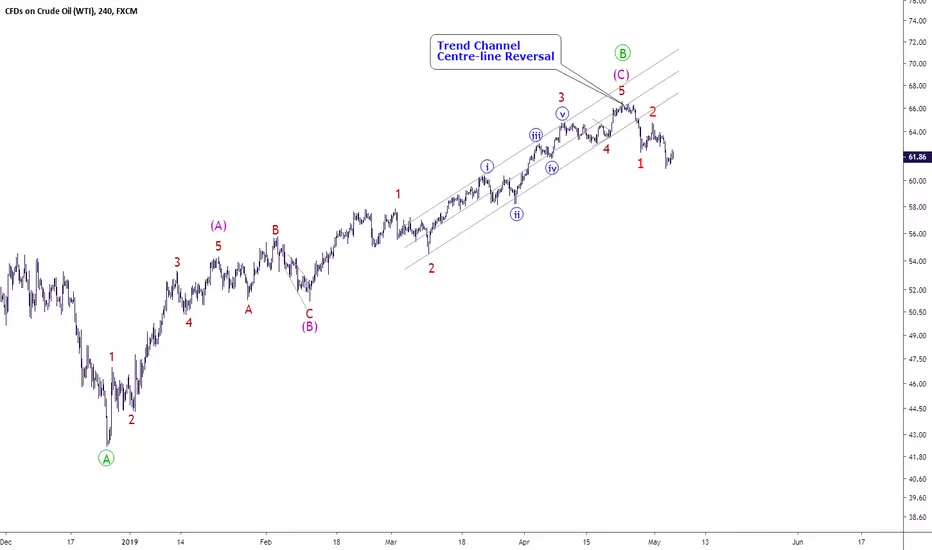
It might be bit early to call the end of bullish rally since late December 2018. But we could certainly have a count that shows wave (C) of {B} has reached it's peak.
Uwaga
But the above count does not necessarily mean the start of the multi months bear market, here is an alternative countUwaga
possible Long-term wave countUwaga
Divergence between RSI & Price, but price is still trading above the blue up trend line
Uwaga
short-term countUwaga
any push above 64.72 would argue either wave 4 or wave 5 is under wayUwaga
Uwaga
break below the blue wave {i} low at 60.04 would indicate wave {iii} decline is under wayUwaga
there are two possible bearish counts: either 1-2 or 1-2 plus {i}-{ii}Uwaga
Uwaga
The '1-2' scenario also has two possible counts flat {b} of 2
triangle {b} of 2
Uwaga
break below 62.09 ( end of wave (i) of {c} of 2) would indicate blue wave {c} is doneUwaga
The '1-2 plus {i}-{ii}' scenario Uwaga
Uwaga
also notice that price has failed number of times to climb back above the uptrend lineUwaga
Therefore I think it's less likely to see another wave 5 of (C). A solid close below $60.02 (6 May low) would confirm the above bearish counts.Uwaga
is wave 3 ready to explode?
Uwaga
Short-term countUwaga
daily chartUwaga
we could also assume the 1-2 is one degree higher and count the structure as followsUwaga
Uwaga
possible short-term counts:either
or
Uwaga
Uwaga
alternative countUwaga
Uwaga
wave {iv} under way?
Uwaga
Uwaga
wave (iv) could be a triangleUwaga
Uwaga
possible short-term counts:wave 3 done ( or if 1-2 = (1)-(2), then 3 = 1 of (3) )
Uwaga
or wave (i)-(ii) of {v} Uwaga
immediate break above end of wave {iv} at $53.36 would eliminate the above (i)-(ii) scenarioUwaga
Uwaga
wave 4 or wave 2 of (3)Uwaga
Uwaga
triangle or flat?
Uwaga
triangleor flat
Uwaga
Uwaga
{a}-{b}-{c} flat with a diagonal wave {c}?Uwaga
Uwaga
or an impulse wave {c}Uwaga
Uwaga
possible short-term countUwaga
possible short-term countUwaga
either way Uwaga
Uwaga
let's see if guppy ema could trigger the bearish signalUwaga
a solid close below wave (iv) low at $57.73 would also argue wave 2 has reached it's peakUwaga
Uwaga
break below wave {a}(of 2) high at $54.80 would confirm the above bearish countUwaga
possible short-term countUwaga
key resistance at $58.32 as wave iv should not breach the end of wave iUwaga
possible short-term countsor
Uwaga
note the rally from recent low at 56.03 is contained within a parallel channelUwaga
triple zigzag?
Uwaga
Uwaga
Need to see an impulsive decline to break below the end of wave x at 57.30Uwaga
Uwaga
alternative countUwaga
possible short-term countUwaga
possible short-term countUwaga
Uwaga
either pink A-B-C complete (Y) or grey (1)-(2) then {i}-{ii}Uwaga
Uwaga
Note on 11 July, i assumed the following two scenarios:Bullish A-B-C for wave (Y)
Bearish (1)-(2)
Uwaga
the bullish count is no longer valid, simply because wave B of a zigzag can never move beyond the start of wave AUwaga
Uwaga
possible short term countsUwaga
bearish green {i}-{ii}-(i)-(ii)OR
bullish grey A-B-C flat for wave (2)
Uwaga
Uwaga
Uwaga
Uwaga
no changeUwaga
Complex flat for wave (2)Simple flat for wave (2)
Uwaga
OR even a more complex correction for wave (2) , e.g. double three combination where wave Y is a triangleUwaga
Flat or Combination
Uwaga
there are some bullish possibilitiesor
Uwaga
medium term expectationsOR

'When you have eliminated the impossible, whatever remains, however improbable must be the truth.'
Email:info@ewc.space
Email:info@ewc.space
Powiązane publikacje
Wyłączenie odpowiedzialności
Informacje i publikacje nie stanowią i nie powinny być traktowane jako porady finansowe, inwestycyjne, tradingowe ani jakiekolwiek inne rekomendacje dostarczane lub zatwierdzone przez TradingView. Więcej informacji znajduje się w Warunkach użytkowania.
'When you have eliminated the impossible, whatever remains, however improbable must be the truth.'
Email:info@ewc.space
Email:info@ewc.space
Powiązane publikacje
Wyłączenie odpowiedzialności
Informacje i publikacje nie stanowią i nie powinny być traktowane jako porady finansowe, inwestycyjne, tradingowe ani jakiekolwiek inne rekomendacje dostarczane lub zatwierdzone przez TradingView. Więcej informacji znajduje się w Warunkach użytkowania.