
The rumours that Saudi Arabia and Russia might decide to increase production caused oil prices to fall to close to 3 % on Friday. Meanwhile; U.S. exports were threatened by potential Chinese tariffs on crude oil and refined products.
Saudi Arabia and Russia have already boosted production modestly, and have indicated they were prepared to increase output at that meeting.
Some investors were surprised when crude oil and other energy products were included for tariffs at a later date, the official Xinhua news agency reported, citing the Tariff Commission of the State Council.
Over the past six months, the United States has exported an average 363,000 bpd of crude oil to China, which along with Canada is the biggest buyer of U.S. crude.
Technically:
The short term trend is bearish.
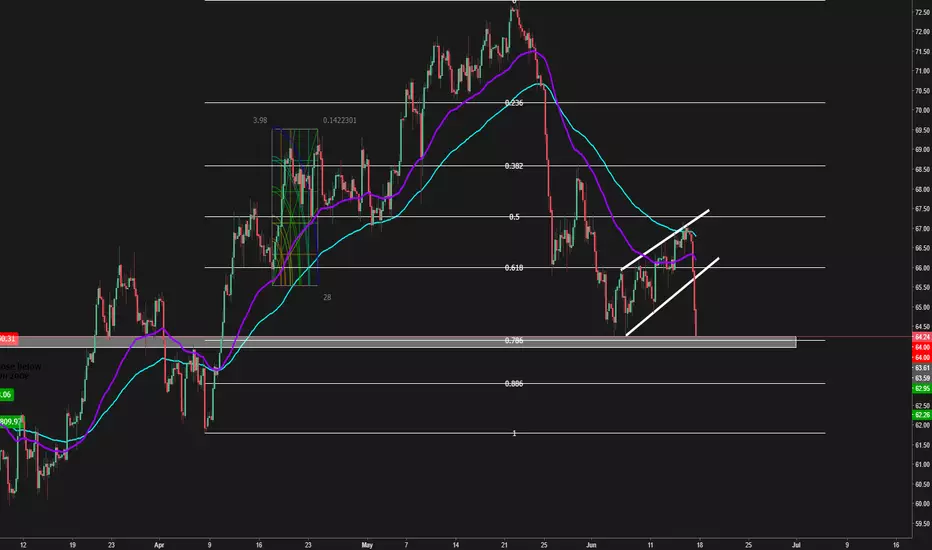
A bearish flag formation completed in the H4 chart. The target of the formation is 62.80.
Crude ended the week 64.24 which meets Fibonacci 78.60 %. At the same level, we see the MM 0/8 Main Support.
From the indicator’s point of view, The price is below EMA 50 and EMA 100 in the daily chart. 62.50 is the main support of the prices.
Key Levels: On the upside 64.45 and 64.28 are the resistance levels. We plan to use possible pullbacks towards those levels as selling opportunities. 62.50 is the main support of the midterm bullish trend. A daily closing below 64.00 USD will carry the prices to 62.50.
Our Bias: BEARISH with the target 62.50
Join Our Premium Club to get the latest analysis and trade ideas with high accuracy.
Saudi Arabia and Russia have already boosted production modestly, and have indicated they were prepared to increase output at that meeting.
Some investors were surprised when crude oil and other energy products were included for tariffs at a later date, the official Xinhua news agency reported, citing the Tariff Commission of the State Council.
Over the past six months, the United States has exported an average 363,000 bpd of crude oil to China, which along with Canada is the biggest buyer of U.S. crude.
Technically:
The short term trend is bearish.
A bearish flag formation completed in the H4 chart. The target of the formation is 62.80.
Crude ended the week 64.24 which meets Fibonacci 78.60 %. At the same level, we see the MM 0/8 Main Support.
From the indicator’s point of view, The price is below EMA 50 and EMA 100 in the daily chart. 62.50 is the main support of the prices.
Key Levels: On the upside 64.45 and 64.28 are the resistance levels. We plan to use possible pullbacks towards those levels as selling opportunities. 62.50 is the main support of the midterm bullish trend. A daily closing below 64.00 USD will carry the prices to 62.50.
Our Bias: BEARISH with the target 62.50
Join Our Premium Club to get the latest analysis and trade ideas with high accuracy.

PM for Live Singals.
🎯 Cycle Sniper and other MT4 Indicator: mql5.com/en/users/elmirair/seller
📊 Join Traders Times on YouTube for Daily Market Prep & Setups (Macro + Technical + Algo):youtube.com/@traderstimestv
🎯 Cycle Sniper and other MT4 Indicator: mql5.com/en/users/elmirair/seller
📊 Join Traders Times on YouTube for Daily Market Prep & Setups (Macro + Technical + Algo):youtube.com/@traderstimestv
Wyłączenie odpowiedzialności
Informacje i publikacje nie stanowią i nie powinny być traktowane jako porady finansowe, inwestycyjne, tradingowe ani jakiekolwiek inne rekomendacje dostarczane lub zatwierdzone przez TradingView. Więcej informacji znajduje się w Warunkach użytkowania.
PM for Live Singals.
🎯 Cycle Sniper and other MT4 Indicator: mql5.com/en/users/elmirair/seller
📊 Join Traders Times on YouTube for Daily Market Prep & Setups (Macro + Technical + Algo):youtube.com/@traderstimestv
🎯 Cycle Sniper and other MT4 Indicator: mql5.com/en/users/elmirair/seller
📊 Join Traders Times on YouTube for Daily Market Prep & Setups (Macro + Technical + Algo):youtube.com/@traderstimestv
Wyłączenie odpowiedzialności
Informacje i publikacje nie stanowią i nie powinny być traktowane jako porady finansowe, inwestycyjne, tradingowe ani jakiekolwiek inne rekomendacje dostarczane lub zatwierdzone przez TradingView. Więcej informacji znajduje się w Warunkach użytkowania.