
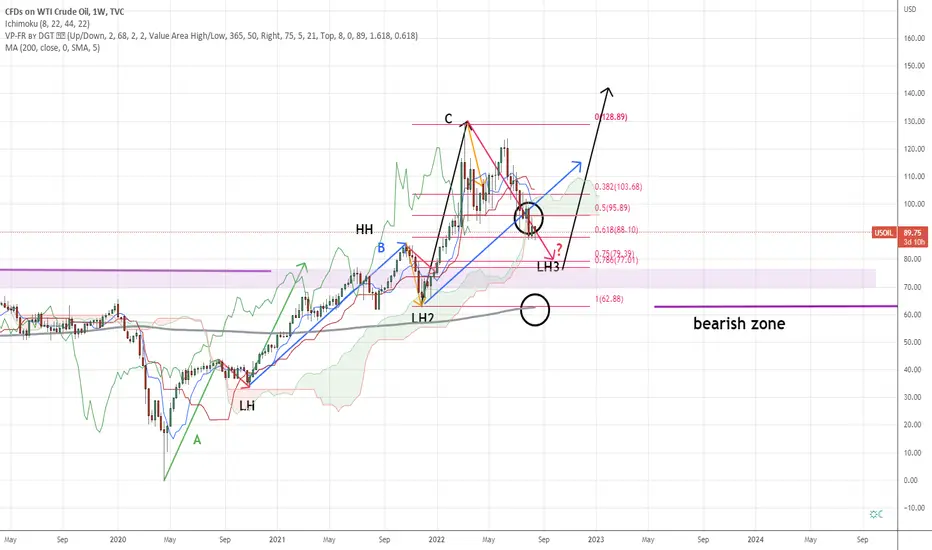
Oil Price still in bullish trend even after retracing from HH2 price of Top of approximately 130 to current 90.
Sign of bullish trend
-Line C having stronger uptrend momentum/strength than line B
-Line C surpass above Fib Extension of 1.272 Line B
-Candlestick above MA200
-Staying above MA(Price approx 63) will still can consider as bullish trend
Some sign of bearish
-Candlestick falling below ichimoku cloud(not bearish confirmation yet)
-lagging Span fall below Candlestick
A closer look on the retracement:
test of downtrend strength within line C

Sign of bullish trend
-Line C having stronger uptrend momentum/strength than line B
-Line C surpass above Fib Extension of 1.272 Line B
-Candlestick above MA200
-Staying above MA(Price approx 63) will still can consider as bullish trend
Some sign of bearish
-Candlestick falling below ichimoku cloud(not bearish confirmation yet)
-lagging Span fall below Candlestick
A closer look on the retracement:
test of downtrend strength within line C

Wyłączenie odpowiedzialności
Informacje i publikacje nie stanowią i nie powinny być traktowane jako porady finansowe, inwestycyjne, tradingowe ani jakiekolwiek inne rekomendacje dostarczane lub zatwierdzone przez TradingView. Więcej informacji znajduje się w Warunkach użytkowania.
Wyłączenie odpowiedzialności
Informacje i publikacje nie stanowią i nie powinny być traktowane jako porady finansowe, inwestycyjne, tradingowe ani jakiekolwiek inne rekomendacje dostarczane lub zatwierdzone przez TradingView. Więcej informacji znajduje się w Warunkach użytkowania.