
📊 Single-Family Home Prices Priced in Gold (1971–2026)
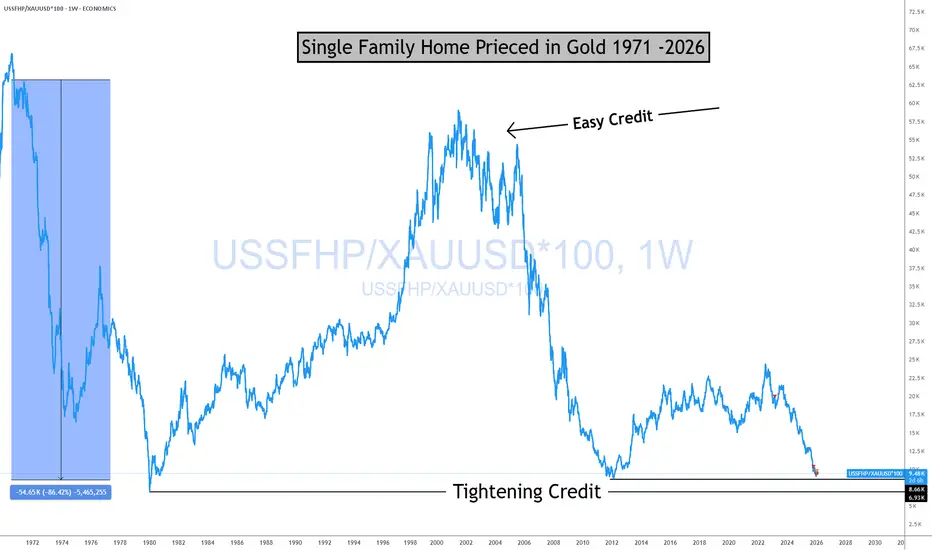
This chart shows the price of a U.S. single-family home measured in ounces of gold, not dollars, going back to the early 1970s.
Why this matters:
Tight Credit is not good for markets! Bad JUJU!
Gold acts as a long-term monetary benchmark. Pricing homes in gold strips out currency effects and helps reveal real cycles, not nominal noise. It gives us insight into how the market is looking at credit going forward.
🔎 What the chart shows (facts)
Home prices in gold move in long, multi-decade cycles
Peaks tend to occur during periods of:
Troughs tend to follow:
Historically, these cycles are not random and not short-term.
Bottom line
This chart is about relative value, monetary regimes, and long-term structure.
For new traders:
Learn to separate nominal prices from real purchasing power, "VALUE" and you’ll start seeing markets more clearly.
Structure first. Emotion later.
The home didn't change
The Currency did.
I strongly encourage traders and investors to understand the operational mechanics of the monetary system. There is a meaningful distinction between money and currency, and this chart highlights that difference clearly.
Understanding that distinction changes how you interpret cycles, value, and risk.
If you enjoy the work:
👉 Drop a solid comment
Let’s push it to 6,000 and keep building a community grounded in raw truth, not hype.
This chart shows the price of a U.S. single-family home measured in ounces of gold, not dollars, going back to the early 1970s.
Why this matters:
Tight Credit is not good for markets! Bad JUJU!
Gold acts as a long-term monetary benchmark. Pricing homes in gold strips out currency effects and helps reveal real cycles, not nominal noise. It gives us insight into how the market is looking at credit going forward.
🔎 What the chart shows (facts)
Home prices in gold move in long, multi-decade cycles
Peaks tend to occur during periods of:
- easy credit
- suppressed interest rates
- strong belief in “housing always goes up”
Troughs tend to follow:
- monetary tightening
- credit contraction
- stress resets in the financial system
Historically, these cycles are not random and not short-term.
Bottom line
This chart is about relative value, monetary regimes, and long-term structure.
For new traders:
Learn to separate nominal prices from real purchasing power, "VALUE" and you’ll start seeing markets more clearly.
Structure first. Emotion later.
The home didn't change
The Currency did.
I strongly encourage traders and investors to understand the operational mechanics of the monetary system. There is a meaningful distinction between money and currency, and this chart highlights that difference clearly.
Understanding that distinction changes how you interpret cycles, value, and risk.
If you enjoy the work:
👉 Drop a solid comment
Let’s push it to 6,000 and keep building a community grounded in raw truth, not hype.

Real Macro Economic Investing
patreon.com/Realmacro
patreon.com/Realmacro
Powiązane publikacje
Wyłączenie odpowiedzialności
Informacje i publikacje nie stanowią i nie powinny być traktowane jako porady finansowe, inwestycyjne, tradingowe ani jakiekolwiek inne rekomendacje dostarczane lub zatwierdzone przez TradingView. Więcej informacji znajduje się w Warunkach użytkowania.
Real Macro Economic Investing
patreon.com/Realmacro
patreon.com/Realmacro
Powiązane publikacje
Wyłączenie odpowiedzialności
Informacje i publikacje nie stanowią i nie powinny być traktowane jako porady finansowe, inwestycyjne, tradingowe ani jakiekolwiek inne rekomendacje dostarczane lub zatwierdzone przez TradingView. Więcej informacji znajduje się w Warunkach użytkowania.