
# Valero Energy (VLO) — Bull Thesis
## 1. Core Thesis
The bullish case for Valero Energy is fundamentally a **refined-products scarcity and refining-margin thesis**, rather than a simple bet on higher crude oil prices.
The key relationship is:
**Refined-product value − crude/feedstock cost = refining margin**
If gasoline, diesel, jet fuel, and other refined products remain expensive relative to crude inputs, Valero can experience substantial earnings and cash-flow leverage through wider crack spreads.
The thesis is therefore:
> **VLO has significant upside potential if refined-product prices remain structurally strong relative to crude input costs, because constrained refining capacity can produce persistent or expanding crack spreads and disproportionately strong cash generation.**
Higher crude prices can reinforce this thesis, but crude itself is not the entire argument. The critical variable is the relationship between **feedstock costs and finished-product prices**.
---
## 2. The Physical Market Is More Constrained in Products Than in Crude
The current energy environment is better understood as a question of **refining capacity and product availability** than simply whether crude oil is expensive.
Crude can be transported, stored, and sourced from multiple producing regions. Finished products, however, require functioning refining infrastructure. Refinery outages, maintenance, closures, transportation constraints, and geographic mismatches between supply and demand can tighten the product market.
Refining capacity is also difficult to replace quickly. New capacity requires enormous capital investment, engineering, permitting, construction, specialized equipment, and years of development. Existing capacity can therefore disappear much faster than replacement capacity can be created.
That creates an asymmetric physical-market condition:
> **Refining capacity can disappear relatively quickly, while replacement capacity can take years.**
If refined-product demand remains resilient while available refining capacity remains constrained, elevated margins can persist considerably longer than a conventional commodity-cycle analysis might suggest.
Valero's historical earnings demonstrate the resulting operating leverage: changes in refining margins can produce disproportionately large changes in profitability and cash generation.
---
## 3. The Equity May Be Adjusting to a Different Earnings Regime
Markets do not necessarily reprice a cyclical energy company immediately when its operating environment changes.
There can be a substantial difference between historical earnings assumptions, analyst expectations, current physical-market conditions, realized refining margins, and the earnings power implied by those margins.
If the market begins recognizing that elevated refining margins are more persistent than previously expected, VLO can undergo a valuation adjustment.
This is particularly important when investors remain anchored to historical normalized earnings. A structural change in product availability or refining capacity can make those historical assumptions less representative of the company's current earnings environment.
The fundamental case therefore rests on:
**constrained refining capacity + strong refined-product pricing + favorable crack spreads + Valero's operating leverage.**
---
## 4. The Logarithmic Model Is Horizon-Based and Measurable
The quantitative model is **horizon-based rather than date-based** and is derived from measurable market inputs rather than discretionary price targets.
Its principal inputs are:
* **Observed price** and its historical trajectory.
* **Time resolution**, with daily data supporting the intermediate-term structure and monthly data supporting the long-term structure.
* **Measured price volatility** over the relevant observation period.
* **Logarithmic price relationships**, which represent proportional rather than purely linear price movement.
* **The resulting historical price/volatility distribution** from which the bands are calculated.
The model therefore separates three things:
**Measured inputs → mathematical outputs → analytical interpretation.**
The inputs are observable. The logarithmic bands and mathematical bounds are calculated. The interpretation of whether price is moving toward an upper or lower bound is the analytical component.
### Daily Structure
The daily structure is intended for **intermediate-term analysis, approximately 90+ days**.
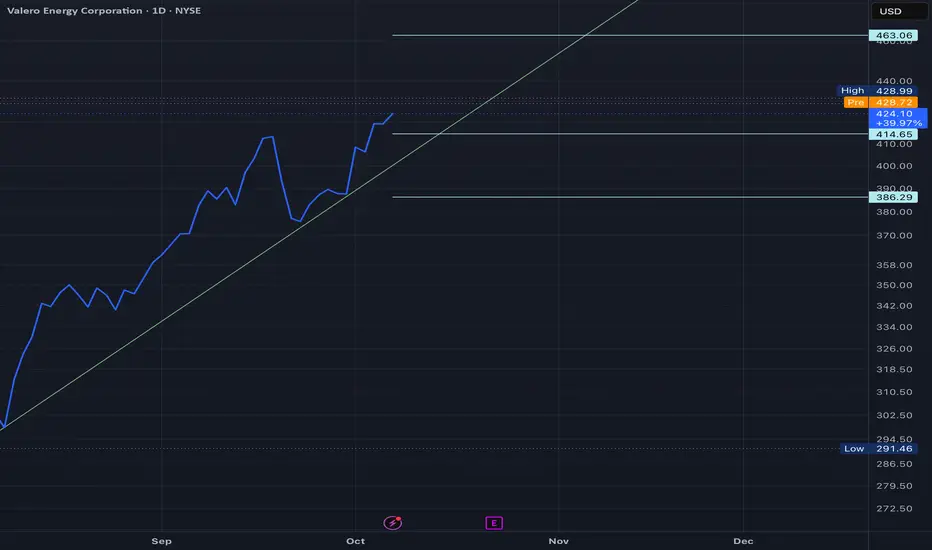
The current VLO analysis places **$463 within this daily mathematical structure**.
### Monthly Structure
The monthly structure is intended for **long-term analysis, approximately 1+ years**.
The monthly bands therefore describe the longer-duration logarithmic structure rather than a one-year price target.
> **The band determines the appropriate mathematical horizon; it does not determine the date on which a price boundary will be reached.**
Accordingly, the $463 level is not a dated price target. It is the current upper directional mathematical bound generated by the daily logarithmic structure.
---
## 5. Mathematical Bound vs. Absolute Mathematical Limit
The terminology is deliberate.
A **mathematical bound** describes a directional constraint or envelope generated by the current mathematical structure. It does not necessarily mean that the level is immutable or impossible to cross.
An **absolute mathematical limit** is substantially stronger. It implies a hard maximum or minimum beyond which the mathematical system cannot proceed.
For this analysis:
* **$463 is a daily directional mathematical bound.**
* **$386 is a directional mathematical bound.**
* Neither is an absolute mathematical limit.
* Neither is a conventional price target.
If subsequent price and volatility observations materially change the underlying distribution, the logarithmic structure can evolve and generate new bounds.
That is **model recalculation**, not discretionary movement of a price target.
---
## 6. The Current Quantitative Structure Favors $463
The current daily logarithmic structure provides a directional envelope extending approximately from **$386 to $463**.
Higher crude prices make the upside direction particularly interesting because stronger crude can coincide with stronger refined-product pricing and reinforce the fundamental refining-margin thesis. But the mathematical signal does not depend exclusively upon crude.
The more important observation is that **VLO's actual price trajectory is currently interacting with the daily logarithmic structure in a manner that points toward the upper bound**.
> **The current model indicates directional movement toward the $463 daily mathematical bound.**
That is a statement about the direction indicated by the current mathematical structure, not a claim that $463 must be reached by a particular date.
The longer-term monthly structure provides an additional observation: **the monthly mathematical bounds are having difficulty keeping pace with VLO's performance logarithmically**.
This does not mean the monthly model is defective. Rather, it indicates that the realized trajectory is currently moving faster than the longer-term logarithmic structure has historically anticipated.
The two structures are therefore communicating different information:
* **Daily:** the intermediate-term structure points toward approximately $463.
* **Monthly:** the longer-term structure is struggling to accommodate the magnitude and persistence of the recent move.
That divergence is itself meaningful.
---
## 7. Risk Management and Mathematical Direction Are Different Questions
A shrewd investor could reasonably choose to wait through the fourth quarter for additional confirmation.
Waiting provides additional observations of:
* price,
* volatility,
* refining margins,
* earnings,
* inventories,
* and the persistence of the current market regime.
That is a legitimate risk-management decision.
But risk management and mathematical direction answer different questions.
Risk management asks:
> **“Should I wait for more confirmation before accepting the risk?”**
The quantitative model asks:
> **“Given the actual price and volatility structure currently observed, which direction does the mathematical envelope indicate?”**
Those answers do not have to be identical.
A cautious investor can wait.
The mathematical structure can nevertheless indicate that the current directional path is toward **$463**.
Waiting for confirmation does not invalidate the existing signal; it represents a decision about risk tolerance and uncertainty.
---
## 8. The Model Should Evolve With Data, Not With Commentary
Because the bands already incorporate price movement and volatility mathematically, they should not be manually adjusted simply because price approaches a visually inconvenient level.
The appropriate methodology is:
**Continuous calculation → periodic methodological review → recalibration only when mathematically justified.**
A quarterly review can therefore be useful, but it should be a review of the **methodology**, not an automatic quarterly adjustment of the bands.
If VLO moves through $463, the question should not be:
> “Where should I move the target?”
It should be:
> **“Has the underlying price/volatility distribution changed sufficiently to produce a new logarithmic structure?”**
If so, the model recalculates.
That is not moving a target. It is updating the mathematical model in response to new data.
This distinction preserves reproducibility and prevents the model from becoming a visually fitted forecasting instrument.
---
# Principal Risk
The principal fundamental risk is **normalization of refining margins**.
The bullish thesis weakens if:
* refinery capacity returns faster than expected,
* product inventories rebuild substantially,
* refined-product demand weakens,
* demand destruction becomes significant,
* product prices decline faster than crude input costs,
* or refining margins compress materially.
The quantitative model carries a separate methodological risk: a mathematical bound describes the **current modeled structure**, not an immutable law of the market.
If the underlying distribution changes, the model must change with it.
That is why **mathematical bound** and **absolute mathematical limit** must remain distinct concepts.
---
# Bottom Line
The bullish case for VLO is not simply that oil prices are rising.
It is that **refined-product economics may be operating in a constrained physical market while Valero retains substantial leverage to the resulting refining margins**.
The quantitative model reinforces that fundamental thesis.
The current daily logarithmic structure identifies approximately **$463 as the upper directional mathematical bound** and **$386 as the lower directional mathematical bound**. The daily structure is appropriate for an intermediate-term horizon of approximately **90+ days**, while the monthly structure is intended for approximately **1+ years**.
The monthly structure is currently having difficulty keeping pace with VLO's logarithmic performance, while the daily structure points toward the $463 upper bound.
A risk-conscious investor could reasonably wait through the fourth quarter for additional confirmation.
But waiting for confirmation and identifying the current mathematical direction are different exercises.
**The current price behavior and underlying logarithmic mathematics point toward $463.**
That makes $463 the **current daily directional mathematical bound**—not an absolute mathematical limit and not a dated price target.
## 1. Core Thesis
The bullish case for Valero Energy is fundamentally a **refined-products scarcity and refining-margin thesis**, rather than a simple bet on higher crude oil prices.
The key relationship is:
**Refined-product value − crude/feedstock cost = refining margin**
If gasoline, diesel, jet fuel, and other refined products remain expensive relative to crude inputs, Valero can experience substantial earnings and cash-flow leverage through wider crack spreads.
The thesis is therefore:
> **VLO has significant upside potential if refined-product prices remain structurally strong relative to crude input costs, because constrained refining capacity can produce persistent or expanding crack spreads and disproportionately strong cash generation.**
Higher crude prices can reinforce this thesis, but crude itself is not the entire argument. The critical variable is the relationship between **feedstock costs and finished-product prices**.
---
## 2. The Physical Market Is More Constrained in Products Than in Crude
The current energy environment is better understood as a question of **refining capacity and product availability** than simply whether crude oil is expensive.
Crude can be transported, stored, and sourced from multiple producing regions. Finished products, however, require functioning refining infrastructure. Refinery outages, maintenance, closures, transportation constraints, and geographic mismatches between supply and demand can tighten the product market.
Refining capacity is also difficult to replace quickly. New capacity requires enormous capital investment, engineering, permitting, construction, specialized equipment, and years of development. Existing capacity can therefore disappear much faster than replacement capacity can be created.
That creates an asymmetric physical-market condition:
> **Refining capacity can disappear relatively quickly, while replacement capacity can take years.**
If refined-product demand remains resilient while available refining capacity remains constrained, elevated margins can persist considerably longer than a conventional commodity-cycle analysis might suggest.
Valero's historical earnings demonstrate the resulting operating leverage: changes in refining margins can produce disproportionately large changes in profitability and cash generation.
---
## 3. The Equity May Be Adjusting to a Different Earnings Regime
Markets do not necessarily reprice a cyclical energy company immediately when its operating environment changes.
There can be a substantial difference between historical earnings assumptions, analyst expectations, current physical-market conditions, realized refining margins, and the earnings power implied by those margins.
If the market begins recognizing that elevated refining margins are more persistent than previously expected, VLO can undergo a valuation adjustment.
This is particularly important when investors remain anchored to historical normalized earnings. A structural change in product availability or refining capacity can make those historical assumptions less representative of the company's current earnings environment.
The fundamental case therefore rests on:
**constrained refining capacity + strong refined-product pricing + favorable crack spreads + Valero's operating leverage.**
---
## 4. The Logarithmic Model Is Horizon-Based and Measurable
The quantitative model is **horizon-based rather than date-based** and is derived from measurable market inputs rather than discretionary price targets.
Its principal inputs are:
* **Observed price** and its historical trajectory.
* **Time resolution**, with daily data supporting the intermediate-term structure and monthly data supporting the long-term structure.
* **Measured price volatility** over the relevant observation period.
* **Logarithmic price relationships**, which represent proportional rather than purely linear price movement.
* **The resulting historical price/volatility distribution** from which the bands are calculated.
The model therefore separates three things:
**Measured inputs → mathematical outputs → analytical interpretation.**
The inputs are observable. The logarithmic bands and mathematical bounds are calculated. The interpretation of whether price is moving toward an upper or lower bound is the analytical component.
### Daily Structure
The daily structure is intended for **intermediate-term analysis, approximately 90+ days**.
The current VLO analysis places **$463 within this daily mathematical structure**.
### Monthly Structure
The monthly structure is intended for **long-term analysis, approximately 1+ years**.
The monthly bands therefore describe the longer-duration logarithmic structure rather than a one-year price target.
> **The band determines the appropriate mathematical horizon; it does not determine the date on which a price boundary will be reached.**
Accordingly, the $463 level is not a dated price target. It is the current upper directional mathematical bound generated by the daily logarithmic structure.
---
## 5. Mathematical Bound vs. Absolute Mathematical Limit
The terminology is deliberate.
A **mathematical bound** describes a directional constraint or envelope generated by the current mathematical structure. It does not necessarily mean that the level is immutable or impossible to cross.
An **absolute mathematical limit** is substantially stronger. It implies a hard maximum or minimum beyond which the mathematical system cannot proceed.
For this analysis:
* **$463 is a daily directional mathematical bound.**
* **$386 is a directional mathematical bound.**
* Neither is an absolute mathematical limit.
* Neither is a conventional price target.
If subsequent price and volatility observations materially change the underlying distribution, the logarithmic structure can evolve and generate new bounds.
That is **model recalculation**, not discretionary movement of a price target.
---
## 6. The Current Quantitative Structure Favors $463
The current daily logarithmic structure provides a directional envelope extending approximately from **$386 to $463**.
Higher crude prices make the upside direction particularly interesting because stronger crude can coincide with stronger refined-product pricing and reinforce the fundamental refining-margin thesis. But the mathematical signal does not depend exclusively upon crude.
The more important observation is that **VLO's actual price trajectory is currently interacting with the daily logarithmic structure in a manner that points toward the upper bound**.
> **The current model indicates directional movement toward the $463 daily mathematical bound.**
That is a statement about the direction indicated by the current mathematical structure, not a claim that $463 must be reached by a particular date.
The longer-term monthly structure provides an additional observation: **the monthly mathematical bounds are having difficulty keeping pace with VLO's performance logarithmically**.
This does not mean the monthly model is defective. Rather, it indicates that the realized trajectory is currently moving faster than the longer-term logarithmic structure has historically anticipated.
The two structures are therefore communicating different information:
* **Daily:** the intermediate-term structure points toward approximately $463.
* **Monthly:** the longer-term structure is struggling to accommodate the magnitude and persistence of the recent move.
That divergence is itself meaningful.
---
## 7. Risk Management and Mathematical Direction Are Different Questions
A shrewd investor could reasonably choose to wait through the fourth quarter for additional confirmation.
Waiting provides additional observations of:
* price,
* volatility,
* refining margins,
* earnings,
* inventories,
* and the persistence of the current market regime.
That is a legitimate risk-management decision.
But risk management and mathematical direction answer different questions.
Risk management asks:
> **“Should I wait for more confirmation before accepting the risk?”**
The quantitative model asks:
> **“Given the actual price and volatility structure currently observed, which direction does the mathematical envelope indicate?”**
Those answers do not have to be identical.
A cautious investor can wait.
The mathematical structure can nevertheless indicate that the current directional path is toward **$463**.
Waiting for confirmation does not invalidate the existing signal; it represents a decision about risk tolerance and uncertainty.
---
## 8. The Model Should Evolve With Data, Not With Commentary
Because the bands already incorporate price movement and volatility mathematically, they should not be manually adjusted simply because price approaches a visually inconvenient level.
The appropriate methodology is:
**Continuous calculation → periodic methodological review → recalibration only when mathematically justified.**
A quarterly review can therefore be useful, but it should be a review of the **methodology**, not an automatic quarterly adjustment of the bands.
If VLO moves through $463, the question should not be:
> “Where should I move the target?”
It should be:
> **“Has the underlying price/volatility distribution changed sufficiently to produce a new logarithmic structure?”**
If so, the model recalculates.
That is not moving a target. It is updating the mathematical model in response to new data.
This distinction preserves reproducibility and prevents the model from becoming a visually fitted forecasting instrument.
---
# Principal Risk
The principal fundamental risk is **normalization of refining margins**.
The bullish thesis weakens if:
* refinery capacity returns faster than expected,
* product inventories rebuild substantially,
* refined-product demand weakens,
* demand destruction becomes significant,
* product prices decline faster than crude input costs,
* or refining margins compress materially.
The quantitative model carries a separate methodological risk: a mathematical bound describes the **current modeled structure**, not an immutable law of the market.
If the underlying distribution changes, the model must change with it.
That is why **mathematical bound** and **absolute mathematical limit** must remain distinct concepts.
---
# Bottom Line
The bullish case for VLO is not simply that oil prices are rising.
It is that **refined-product economics may be operating in a constrained physical market while Valero retains substantial leverage to the resulting refining margins**.
The quantitative model reinforces that fundamental thesis.
The current daily logarithmic structure identifies approximately **$463 as the upper directional mathematical bound** and **$386 as the lower directional mathematical bound**. The daily structure is appropriate for an intermediate-term horizon of approximately **90+ days**, while the monthly structure is intended for approximately **1+ years**.
The monthly structure is currently having difficulty keeping pace with VLO's logarithmic performance, while the daily structure points toward the $463 upper bound.
A risk-conscious investor could reasonably wait through the fourth quarter for additional confirmation.
But waiting for confirmation and identifying the current mathematical direction are different exercises.
**The current price behavior and underlying logarithmic mathematics point toward $463.**
That makes $463 the **current daily directional mathematical bound**—not an absolute mathematical limit and not a dated price target.
Uwaga
"What is his price?""VLO 10,000 @ $423.54 > Profit Realization @ $430.27 > 1 @ $433 > 999 @ $432.06 > Profit Realization @ $437.50 > Added 166 to a forever hold @ $0. My price is $0."
Uwaga
"Yeah, Ancient Sumerians were reading the exact same." < Anonymous"Yeah, Ancient Sumerians were reading the exact same." < HPP
"Yeah, Ancient Sumerians were reading the exact same." < Anonymous
Ancient Sumerians is the proper English spelling. Enjoy! We're done for the day.
Uwaga
"I think he just tried buying a million barrels of oil and saying "Do you guys have that?""LMFAO
Uwaga
"All it takes is one guy saying he doesn't have a job because oil isn't $200 a barrel and everybody else starts wondering what the fuck they're doing."
Wyłączenie odpowiedzialności
Informacje i publikacje nie stanowią i nie powinny być traktowane jako porady finansowe, inwestycyjne, tradingowe ani jakiekolwiek inne rekomendacje dostarczane lub zatwierdzone przez TradingView. Więcej informacji znajduje się w Warunkach użytkowania.
Wyłączenie odpowiedzialności
Informacje i publikacje nie stanowią i nie powinny być traktowane jako porady finansowe, inwestycyjne, tradingowe ani jakiekolwiek inne rekomendacje dostarczane lub zatwierdzone przez TradingView. Więcej informacji znajduje się w Warunkach użytkowania.