
Hello traders,
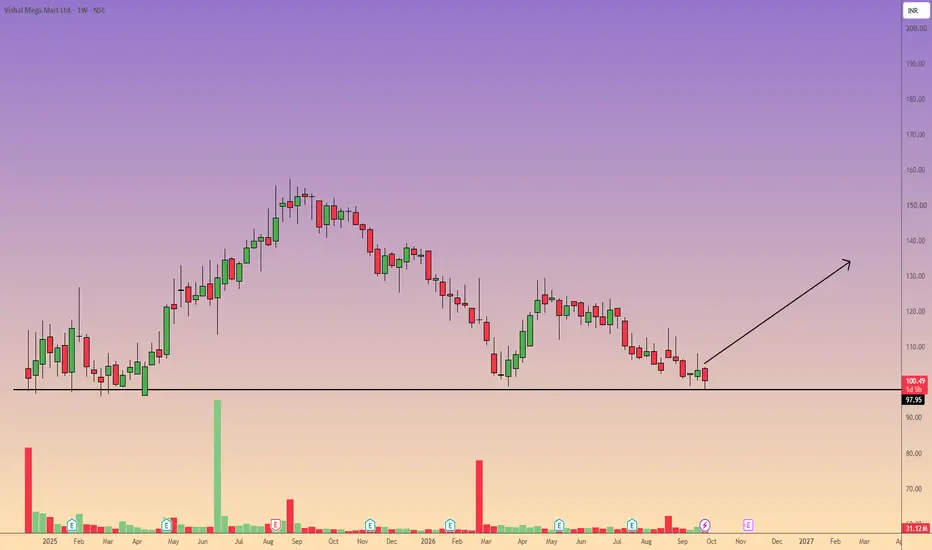
Looking at the weekly chart for Vishal Mega Mart Ltd. (NSE), we can observe a prolonged corrective phase after the stock peaked near the ₹150–155 range late last year.
The price has been printing lower highs and lower lows for several months, reflecting strong bearish momentum.
However, the stock is currently hovering at ₹100.60 and is testing a major historical support level at ₹97.95 (indicated by the solid black horizontal line).
This is a critical "make-or-break" zone. Historically, this level acted as a strong base in early 2025 before initiating a massive multi-month rally.
Technical Rationale:
Because this is a weekly timeframe, the ₹98 level represents significant structural support.
The current price action shows consolidation just above this line. If buyers step in to defend this zone, we could see a strong bounce or trend reversal.
Conversely, a high-volume breakdown below this baseline could trigger a deeper sell-off. Therefore, patience is key—waiting for a clear bullish reversal pattern (like a hammer or bullish engulfing candle) on the daily or weekly timeframe is recommended before entering.
Potential Trade Setup (Long Bias upon Confirmation):
Entry Point: ₹98.00 – ₹101.00 (Enter only after seeing bullish price action confirmation at this support zone).
Target 1 (TP1): ₹120.00 (Previous minor swing high and resistance zone).
Target 2 (TP2): ₹135.00 (Major structural resistance from previous breakdown levels).
Stop Loss: A weekly close below ₹94.00. (Closing definitively below the ₹97.95 support line invalidates the bullish thesis and suggests further downside).
Looking at the weekly chart for Vishal Mega Mart Ltd. (NSE), we can observe a prolonged corrective phase after the stock peaked near the ₹150–155 range late last year.
The price has been printing lower highs and lower lows for several months, reflecting strong bearish momentum.
However, the stock is currently hovering at ₹100.60 and is testing a major historical support level at ₹97.95 (indicated by the solid black horizontal line).
This is a critical "make-or-break" zone. Historically, this level acted as a strong base in early 2025 before initiating a massive multi-month rally.
Technical Rationale:
Because this is a weekly timeframe, the ₹98 level represents significant structural support.
The current price action shows consolidation just above this line. If buyers step in to defend this zone, we could see a strong bounce or trend reversal.
Conversely, a high-volume breakdown below this baseline could trigger a deeper sell-off. Therefore, patience is key—waiting for a clear bullish reversal pattern (like a hammer or bullish engulfing candle) on the daily or weekly timeframe is recommended before entering.
Potential Trade Setup (Long Bias upon Confirmation):
Entry Point: ₹98.00 – ₹101.00 (Enter only after seeing bullish price action confirmation at this support zone).
Target 1 (TP1): ₹120.00 (Previous minor swing high and resistance zone).
Target 2 (TP2): ₹135.00 (Major structural resistance from previous breakdown levels).
Stop Loss: A weekly close below ₹94.00. (Closing definitively below the ₹97.95 support line invalidates the bullish thesis and suggests further downside).
Transakcja zakończona: osiągnięto poziom stop
Stoploss Hit...
Wyłączenie odpowiedzialności
Informacje i publikacje nie stanowią i nie powinny być traktowane jako porady finansowe, inwestycyjne, tradingowe ani jakiekolwiek inne rekomendacje dostarczane lub zatwierdzone przez TradingView. Więcej informacji znajduje się w Warunkach użytkowania.
Wyłączenie odpowiedzialności
Informacje i publikacje nie stanowią i nie powinny być traktowane jako porady finansowe, inwestycyjne, tradingowe ani jakiekolwiek inne rekomendacje dostarczane lub zatwierdzone przez TradingView. Więcej informacji znajduje się w Warunkach użytkowania.