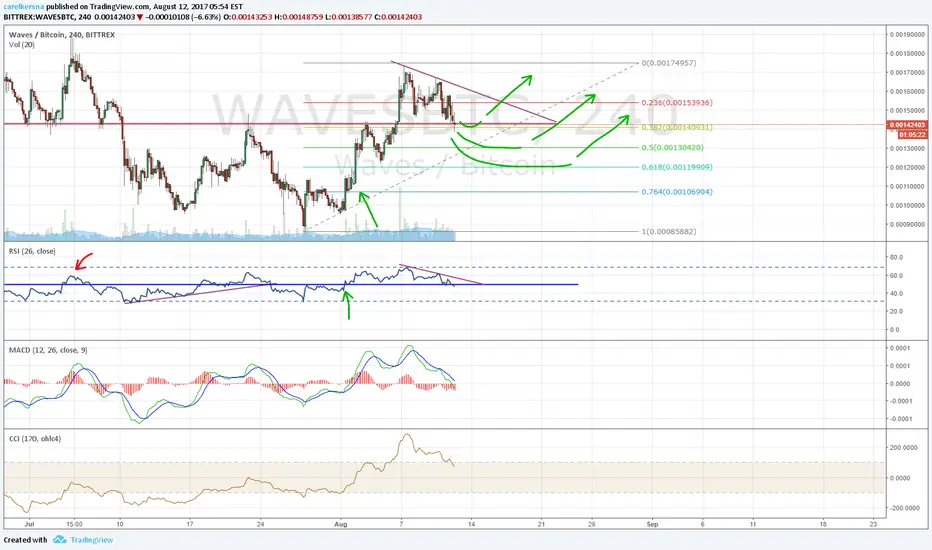
3 levels to watch.
Blue line also represents the 50 line on RSI. Expecting volatility around that level, because every time price makes a great move, RSI breaks below or above 50 level.
So as long as RSI stays above 50, its either movement to the upside or worst case sideways movement.
Blue line also represents the 50 line on RSI. Expecting volatility around that level, because every time price makes a great move, RSI breaks below or above 50 level.
So as long as RSI stays above 50, its either movement to the upside or worst case sideways movement.

Wyłączenie odpowiedzialności
Informacje i publikacje nie stanowią i nie powinny być traktowane jako porady finansowe, inwestycyjne, tradingowe ani jakiekolwiek inne rekomendacje dostarczane lub zatwierdzone przez TradingView. Więcej informacji znajduje się w Warunkach użytkowania.
Wyłączenie odpowiedzialności
Informacje i publikacje nie stanowią i nie powinny być traktowane jako porady finansowe, inwestycyjne, tradingowe ani jakiekolwiek inne rekomendacje dostarczane lub zatwierdzone przez TradingView. Więcej informacji znajduje się w Warunkach użytkowania.