Long
WAVESUSD may be ahead of a very strong monthly rally
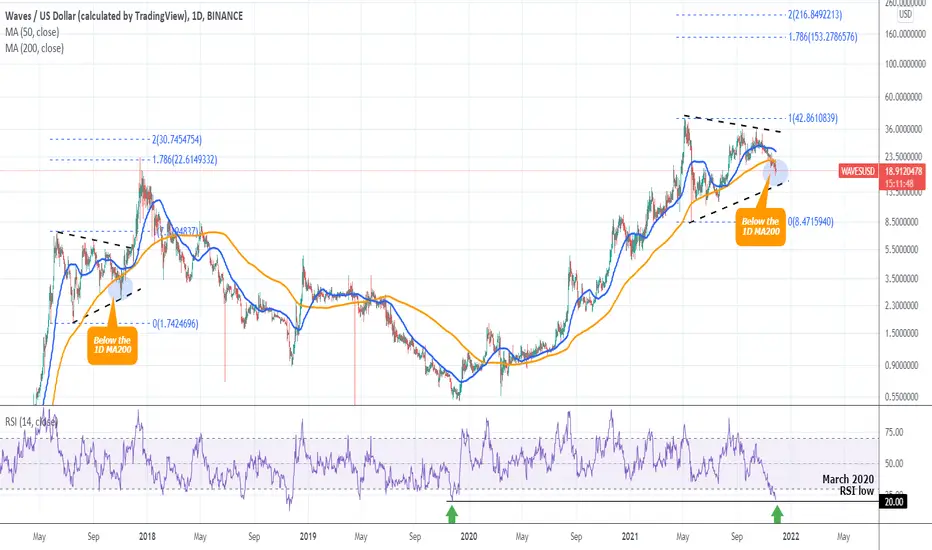
Waves has been trading inside a Triangle pattern since the May All Time High (ATH). Recently it broke below the 1D MA200 (orange trend-line). The RSI is close to its November 2019 bottom.
We saw the same pattern in late 2017 (June - November). At the time, once WAVESUSD broke below its 1D MA200, it made a bottom and then rallied for 1.5 months to its December 2017 Top (ATH at the time) on the 1.786 Fibonacci extension.
Are you expecting a similar pattern continuation?
--------------------------------------------------------------------------------------------------------
** Please support this idea with your likes and comments, it is the best way to keep it relevant and support me. **
--------------------------------------------------------------------------------------------------------
We saw the same pattern in late 2017 (June - November). At the time, once WAVESUSD broke below its 1D MA200, it made a bottom and then rallied for 1.5 months to its December 2017 Top (ATH at the time) on the 1.786 Fibonacci extension.
Are you expecting a similar pattern continuation?
--------------------------------------------------------------------------------------------------------
** Please support this idea with your likes and comments, it is the best way to keep it relevant and support me. **
--------------------------------------------------------------------------------------------------------

I trade Crypto, Forex, Indices & Commodities on PrimeXBT — all from one account with TradingView charts 👉 tradingshot.short.gy/PrimeXBT
I also use TradeNation for fixed spreads & zero commission 👉 tradingshot.short.gy/Tradenation
I also use TradeNation for fixed spreads & zero commission 👉 tradingshot.short.gy/Tradenation
Wyłączenie odpowiedzialności
Informacje i publikacje nie stanowią i nie powinny być traktowane jako porady finansowe, inwestycyjne, tradingowe ani jakiekolwiek inne rekomendacje dostarczane lub zatwierdzone przez TradingView. Więcej informacji znajduje się w Warunkach użytkowania.
I trade Crypto, Forex, Indices & Commodities on PrimeXBT — all from one account with TradingView charts 👉 tradingshot.short.gy/PrimeXBT
I also use TradeNation for fixed spreads & zero commission 👉 tradingshot.short.gy/Tradenation
I also use TradeNation for fixed spreads & zero commission 👉 tradingshot.short.gy/Tradenation
Wyłączenie odpowiedzialności
Informacje i publikacje nie stanowią i nie powinny być traktowane jako porady finansowe, inwestycyjne, tradingowe ani jakiekolwiek inne rekomendacje dostarczane lub zatwierdzone przez TradingView. Więcej informacji znajduje się w Warunkach użytkowania.