
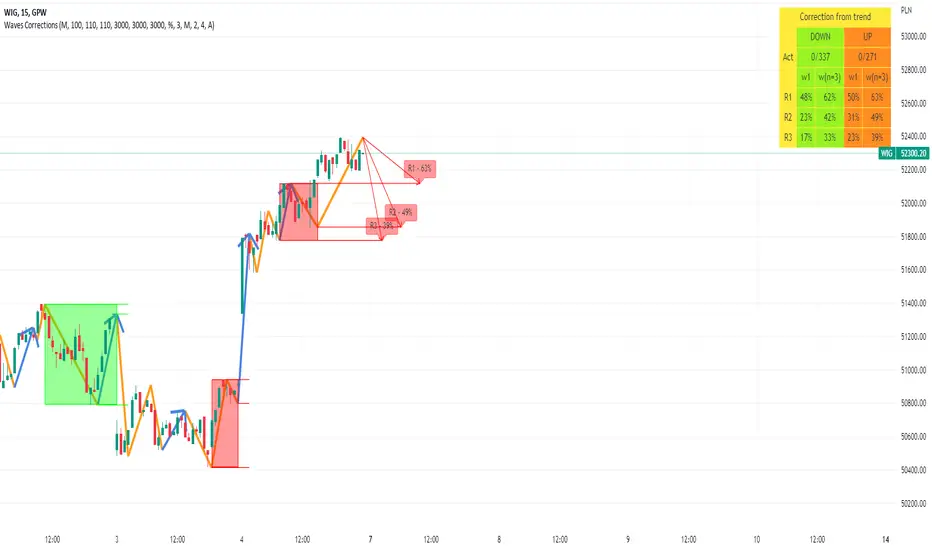
During one of the webinars (unfortunately it is no longer available to the public) I came across the idea of tracking wave patterns and corrections after such patterns, where the wave pattern consists of a long wave preceded by 2 short waves. I have implemented this solution and according to it, the WIG has a 50% chance of returning to the level of 52 120 already in the 1st wave and 63% to the 3rd wave (which is more or less within 1 day). And down to 51,800 23% chance in 1st wave and only 39% chance in 3rd wave.
I cannot wait the results.
I cannot wait the results.
Uwaga
After 4 waves it has not reached TP, but also do not move up over the wave end point (potencial SL): Transakcja zakończona: osiągnięto poziom stop
This idea seems to be fighting with the trend, and as we can see it lost this time. In my free time, I will add SL simulation to that script and check how it will affect the calculation of statistics.

To get access or report problem write on toolkit4trading@proton.me
More details on Website and Youtube.
More details on Website and Youtube.
Wyłączenie odpowiedzialności
Informacje i publikacje nie stanowią i nie powinny być traktowane jako porady finansowe, inwestycyjne, tradingowe ani jakiekolwiek inne rekomendacje dostarczane lub zatwierdzone przez TradingView. Więcej informacji znajduje się w Warunkach użytkowania.