
📊 Silver (XAG/USD) 4H Technical Outlook — Controlled Pullback Within Prior Uptrend ⚖️
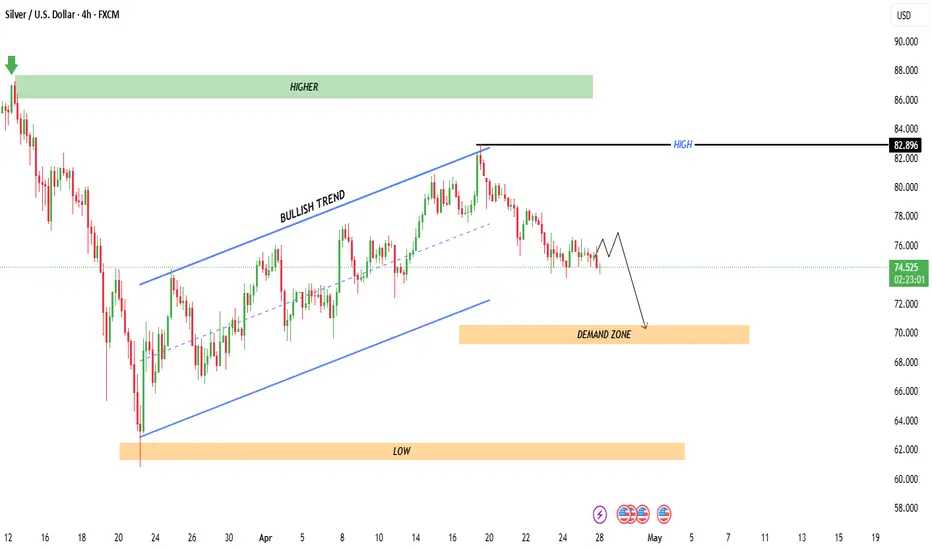
The chart shows Silver / U.S. Dollar (XAG/USD) on the 4-hour timeframe, where price action has recently transitioned from a structured bullish channel into a corrective phase.
🧭 Trend Structure & Context
Price previously respected a bullish ascending channel (clearly defined higher highs and higher lows).
The breakout attempt near the 82.8 resistance (labeled HIGH) failed to sustain momentum.
Since then, structure has shifted into a short-term bearish correction, with lower highs forming.
👉 This suggests loss of bullish momentum, not necessarily a full trend reversal yet.
🔑 Key Levels to Watch
Resistance (Supply): ~82.8
→ Strong rejection zone; buyers failed to maintain control here.
Current Price Area: ~74.5
→ Mid-range consolidation with weak bullish follow-through.
Demand Zone: 69.5 – 71.0
→ Highlighted zone where buyers are expected to step back in.
Major Low Support: ~62
→ Macro support; invalidation zone for broader bullish structure.
📉 Price Behavior & Projection
The chart shows a bearish continuation path (arrow):
Minor consolidation / weak bounce
Followed by a move into the demand zone
📌 This aligns with:
Breakdown from the channel
Failure to create new highs
Gradual formation of lower highs
⚙️ Market Interpretation
The prior bullish trend is weakening, transitioning into a corrective phase.
Sellers currently have short-term control.
However, the broader structure still allows for a bullish reaction at demand.
🧠 Trading Scenarios
🔻 Bearish Scenario (Higher Probability Short-Term)
Rejection below ~76–78 zone
Continuation toward 70 demand area
Momentum likely increases on breakdown
🔄 Bullish Scenario (Conditional)
Strong bounce from demand zone (69–71)
Reclaim of broken trend structure
Target retest of 80–82 highs
⚠️ Risk Factors
Sudden volatility spikes (common in metals)
False breakdowns near demand
Macro catalysts impacting precious metals market
🧾 Summary
📉 Short-term bias: Bearish / corrective
📊 Mid-term outlook: Neutral-to-bullish if demand holds
🎯 Key play: Watch for reaction at 69–71 demand zone
The chart shows Silver / U.S. Dollar (XAG/USD) on the 4-hour timeframe, where price action has recently transitioned from a structured bullish channel into a corrective phase.
🧭 Trend Structure & Context
Price previously respected a bullish ascending channel (clearly defined higher highs and higher lows).
The breakout attempt near the 82.8 resistance (labeled HIGH) failed to sustain momentum.
Since then, structure has shifted into a short-term bearish correction, with lower highs forming.
👉 This suggests loss of bullish momentum, not necessarily a full trend reversal yet.
🔑 Key Levels to Watch
Resistance (Supply): ~82.8
→ Strong rejection zone; buyers failed to maintain control here.
Current Price Area: ~74.5
→ Mid-range consolidation with weak bullish follow-through.
Demand Zone: 69.5 – 71.0
→ Highlighted zone where buyers are expected to step back in.
Major Low Support: ~62
→ Macro support; invalidation zone for broader bullish structure.
📉 Price Behavior & Projection
The chart shows a bearish continuation path (arrow):
Minor consolidation / weak bounce
Followed by a move into the demand zone
📌 This aligns with:
Breakdown from the channel
Failure to create new highs
Gradual formation of lower highs
⚙️ Market Interpretation
The prior bullish trend is weakening, transitioning into a corrective phase.
Sellers currently have short-term control.
However, the broader structure still allows for a bullish reaction at demand.
🧠 Trading Scenarios
🔻 Bearish Scenario (Higher Probability Short-Term)
Rejection below ~76–78 zone
Continuation toward 70 demand area
Momentum likely increases on breakdown
🔄 Bullish Scenario (Conditional)
Strong bounce from demand zone (69–71)
Reclaim of broken trend structure
Target retest of 80–82 highs
⚠️ Risk Factors
Sudden volatility spikes (common in metals)
False breakdowns near demand
Macro catalysts impacting precious metals market
🧾 Summary
📉 Short-term bias: Bearish / corrective
📊 Mid-term outlook: Neutral-to-bullish if demand holds
🎯 Key play: Watch for reaction at 69–71 demand zone
Zlecenie aktywne
XAGUSD Update – Clean Move to Target 🎯🔥
✅ Price respected the bullish structure earlier and tapped the high zone perfectly
📉 Now showing rejection from resistance → shift in momentum
🔄 Market is following the planned bearish path
🎯 Current View
Small pullback ➡️ continuation down
Target: Demand zone (~70 area)
🧠 Summary
Your analysis is playing out well ✔️
Market is moving exactly as expected — stay patient & let it hit TP 🧘♂️📉

✦ MARKET STRATEGY SIGNALS ✦ 📊
Smart Money • Price Action • Precision • good entries
📲 Join Telegram: t.me/marketstrategyentry
Smart Money • Price Action • Precision • good entries
📲 Join Telegram: t.me/marketstrategyentry
Powiązane publikacje
Wyłączenie odpowiedzialności
Informacje i publikacje nie stanowią i nie powinny być traktowane jako porady finansowe, inwestycyjne, tradingowe ani jakiekolwiek inne rekomendacje dostarczane lub zatwierdzone przez TradingView. Więcej informacji znajduje się w Warunkach użytkowania.
✦ MARKET STRATEGY SIGNALS ✦ 📊
Smart Money • Price Action • Precision • good entries
📲 Join Telegram: t.me/marketstrategyentry
Smart Money • Price Action • Precision • good entries
📲 Join Telegram: t.me/marketstrategyentry
Powiązane publikacje
Wyłączenie odpowiedzialności
Informacje i publikacje nie stanowią i nie powinny być traktowane jako porady finansowe, inwestycyjne, tradingowe ani jakiekolwiek inne rekomendacje dostarczane lub zatwierdzone przez TradingView. Więcej informacji znajduje się w Warunkach użytkowania.