
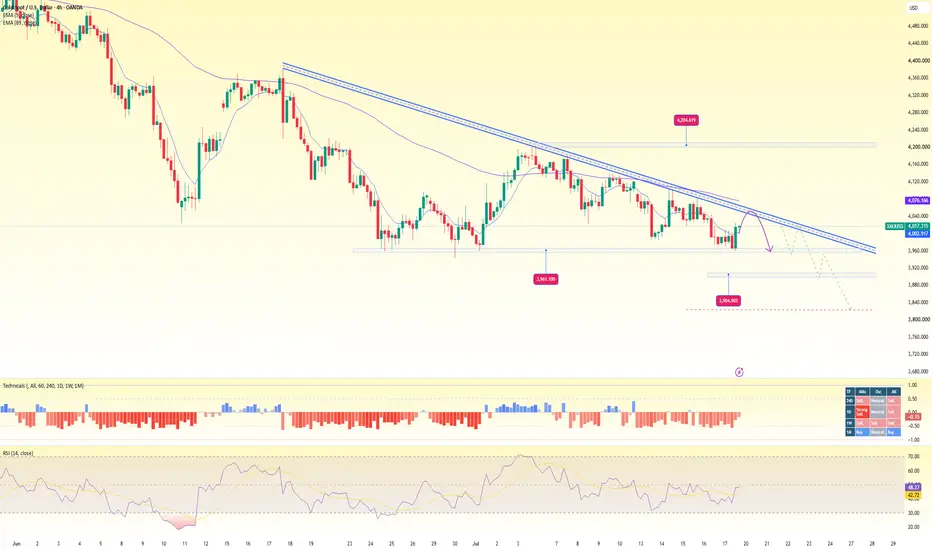
1. Trend
Medium-term trend: Bearish
Price is moving within a descending channel.
The upper descending trendline continues to act as resistance.
EMA9 is below EMA89, confirming that bearish momentum remains dominant.
The market structure continues to form Lower Highs (LH) and Lower Lows (LL).
➡️ The main H4 trend remains bearish.
2. Price Structure
After forming a top around 4,360–4,400, price declined sharply.
Each rebound has been rejected at the descending trendline.
Price is currently pulling back toward the trendline zone around 4,015–4,030.
This area often acts as a retest zone before the downtrend continues.
3. Key Resistance
4,020–4,030
Immediate resistance.
Confluence of:
Descending trendline
EMA9
Previous breakdown zone
A rejection from this area would strongly favor further downside.
4,076
Intermediate resistance.
Coincides with the H4 EMA89.
4,200–4,205
Major resistance / strong supply zone.
A break above this area would be needed to confirm a medium-term reversal.
4. Key Support
3,961
Key support.
Recent swing low within the descending channel.
3,905
Next major support.
Marked as the extended downside target on the chart.
A break below 3,961 could extend the decline toward 3,905 → 3,850.
5. EMA Analysis
EMA9: Sloping downward.
EMA89: Slightly downward, acting as dynamic resistance.
Price remains below both EMAs.
➡️ Sellers remain in control of the H4 trend.
Medium-term trend: Bearish
Price is moving within a descending channel.
The upper descending trendline continues to act as resistance.
EMA9 is below EMA89, confirming that bearish momentum remains dominant.
The market structure continues to form Lower Highs (LH) and Lower Lows (LL).
➡️ The main H4 trend remains bearish.
2. Price Structure
After forming a top around 4,360–4,400, price declined sharply.
Each rebound has been rejected at the descending trendline.
Price is currently pulling back toward the trendline zone around 4,015–4,030.
This area often acts as a retest zone before the downtrend continues.
3. Key Resistance
4,020–4,030
Immediate resistance.
Confluence of:
Descending trendline
EMA9
Previous breakdown zone
A rejection from this area would strongly favor further downside.
4,076
Intermediate resistance.
Coincides with the H4 EMA89.
4,200–4,205
Major resistance / strong supply zone.
A break above this area would be needed to confirm a medium-term reversal.
4. Key Support
3,961
Key support.
Recent swing low within the descending channel.
3,905
Next major support.
Marked as the extended downside target on the chart.
A break below 3,961 could extend the decline toward 3,905 → 3,850.
5. EMA Analysis
EMA9: Sloping downward.
EMA89: Slightly downward, acting as dynamic resistance.
Price remains below both EMAs.
➡️ Sellers remain in control of the H4 trend.
Zlecenie aktywne
The bearish trend is expected to remain dominant at the beginning of next week.
MOON | Forex Academy hopes to bring the best experience to the Forex community
💠 Update the fastest news
💠 Trend analysis: XAU, BTC, Currency,...
💠My channel:
" t.me/+wmcIWR0hqD5mYjhl "
💠 Update the fastest news
💠 Trend analysis: XAU, BTC, Currency,...
💠My channel:
" t.me/+wmcIWR0hqD5mYjhl "
Powiązane publikacje
Wyłączenie odpowiedzialności
Informacje i publikacje nie stanowią i nie powinny być traktowane jako porady finansowe, inwestycyjne, tradingowe ani jakiekolwiek inne rekomendacje dostarczane lub zatwierdzone przez TradingView. Więcej informacji znajduje się w Warunkach użytkowania.
MOON | Forex Academy hopes to bring the best experience to the Forex community
💠 Update the fastest news
💠 Trend analysis: XAU, BTC, Currency,...
💠My channel:
" t.me/+wmcIWR0hqD5mYjhl "
💠 Update the fastest news
💠 Trend analysis: XAU, BTC, Currency,...
💠My channel:
" t.me/+wmcIWR0hqD5mYjhl "
Powiązane publikacje
Wyłączenie odpowiedzialności
Informacje i publikacje nie stanowią i nie powinny być traktowane jako porady finansowe, inwestycyjne, tradingowe ani jakiekolwiek inne rekomendacje dostarczane lub zatwierdzone przez TradingView. Więcej informacji znajduje się w Warunkach użytkowania.