
1. Market Trend
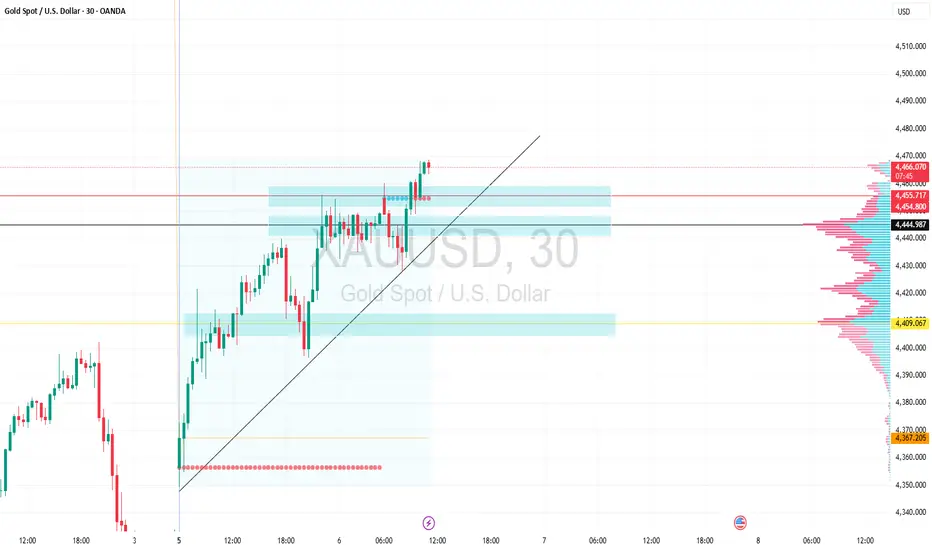
Primary Trend: The market is in a very strong Bullish trend. Price action shows a consistent pattern of Higher Highs (HH) and Higher Lows (HL).
Trendline: There is an ascending trendline supporting the move. The price is currently trading significantly above this line, indicating high bullish momentum.
2. Key Support and Resistance Zones
Looking at the shaded blue boxes and horizontal levels:
Immediate Resistance: The current peak around 4,465 – 4,470. This is the psychological barrier the price is currently testing.
Immediate Support (Minor): The 4,454 – 4,455 zone. This was a previous resistance that has now flipped into potential support (Role Reversal).
Strong Support (POC Zone): Around 4,444. This aligns with a major high-volume node on the Volume Profile, making it a critical "value area."
Major Support Base: The lower blue zone between 4,404 – 4,412, which acted as a significant accumulation area before the latest breakout.
3. Volume Profile Analysis
The Fixed Range Volume Profile on the right side of the chart reveals:
Point of Control (POC): The black horizontal line at 4,444.987 marks the price level with the highest traded volume.
Significance: Prices tend to be attracted to this level during corrections. If the price drops, this is where buyers are most likely to step back in.
4. Price Action Observations
Recent Candles: After a sharp vertical climb, the latest candles are showing smaller bodies and some upper wicks. This suggests that the buying momentum is slightly overstretched, and we might see a short-term consolidation or a technical pullback.
Context: As shown on the bottom axis, the date is January 6, 2026. Be mindful of any high-impact USD economic data scheduled for this session.
Potential Trading Strategies:
Trend Continuation: If the price breaks and closes decisively above 4,470, the bullish run is likely to extend further.
Pullback Entry (Buy the Dip): The most conservative approach would be waiting for a retracement to the 4,454 or 4,444 levels. Look for bullish reversal patterns (like Pin Bars or Engulfing candles) at these supports to join the trend.
Risk Warning: Avoid "picking the top" (Shorting) right now, as there are no clear structural signs of a trend reversal yet.
Note: The gold price shown (above $4,400) is exceptionally high compared to historical norms. Ensure you are following your risk management plan and using Stop Losses.
Primary Trend: The market is in a very strong Bullish trend. Price action shows a consistent pattern of Higher Highs (HH) and Higher Lows (HL).
Trendline: There is an ascending trendline supporting the move. The price is currently trading significantly above this line, indicating high bullish momentum.
2. Key Support and Resistance Zones
Looking at the shaded blue boxes and horizontal levels:
Immediate Resistance: The current peak around 4,465 – 4,470. This is the psychological barrier the price is currently testing.
Immediate Support (Minor): The 4,454 – 4,455 zone. This was a previous resistance that has now flipped into potential support (Role Reversal).
Strong Support (POC Zone): Around 4,444. This aligns with a major high-volume node on the Volume Profile, making it a critical "value area."
Major Support Base: The lower blue zone between 4,404 – 4,412, which acted as a significant accumulation area before the latest breakout.
3. Volume Profile Analysis
The Fixed Range Volume Profile on the right side of the chart reveals:
Point of Control (POC): The black horizontal line at 4,444.987 marks the price level with the highest traded volume.
Significance: Prices tend to be attracted to this level during corrections. If the price drops, this is where buyers are most likely to step back in.
4. Price Action Observations
Recent Candles: After a sharp vertical climb, the latest candles are showing smaller bodies and some upper wicks. This suggests that the buying momentum is slightly overstretched, and we might see a short-term consolidation or a technical pullback.
Context: As shown on the bottom axis, the date is January 6, 2026. Be mindful of any high-impact USD economic data scheduled for this session.
Potential Trading Strategies:
Trend Continuation: If the price breaks and closes decisively above 4,470, the bullish run is likely to extend further.
Pullback Entry (Buy the Dip): The most conservative approach would be waiting for a retracement to the 4,454 or 4,444 levels. Look for bullish reversal patterns (like Pin Bars or Engulfing candles) at these supports to join the trend.
Risk Warning: Avoid "picking the top" (Shorting) right now, as there are no clear structural signs of a trend reversal yet.
Note: The gold price shown (above $4,400) is exceptionally high compared to historical norms. Ensure you are following your risk management plan and using Stop Losses.

Powiązane publikacje
Wyłączenie odpowiedzialności
Informacje i publikacje nie stanowią i nie powinny być traktowane jako porady finansowe, inwestycyjne, tradingowe ani jakiekolwiek inne rekomendacje dostarczane lub zatwierdzone przez TradingView. Więcej informacji znajduje się w Warunkach użytkowania.
Powiązane publikacje
Wyłączenie odpowiedzialności
Informacje i publikacje nie stanowią i nie powinny być traktowane jako porady finansowe, inwestycyjne, tradingowe ani jakiekolwiek inne rekomendacje dostarczane lub zatwierdzone przez TradingView. Więcej informacji znajduje się w Warunkach użytkowania.