
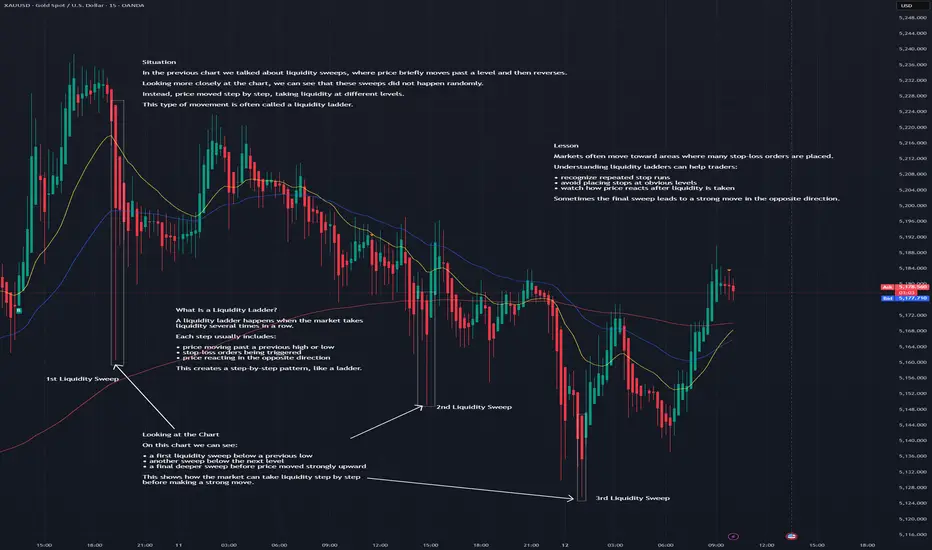
Liquidity Ladder — How the Market Takes Liquidity Step by Step
XAUUSD | M15 | Sentinel Lite
Situation
In the previous chart we talked about liquidity sweeps, where price briefly moves past a level and then reverses.
Looking more closely at the chart, we can see that these sweeps did not happen randomly.
Instead, price moved step by step, taking liquidity at different levels.
This type of movement is often called a liquidity ladder.
What Is a Liquidity Ladder?
A liquidity ladder happens when the market takes liquidity several times in a row.
Each step usually includes:
• price moving past a previous high or low
• stop-loss orders being triggered
• price reacting in the opposite direction
This creates a step-by-step pattern, like a ladder.
Looking at the Chart
On this chart we can see:
• a first liquidity sweep below a previous low
• another sweep below the next level
• a final deeper sweep before price moved strongly upward
This shows how the market can take liquidity step by step before making a strong move.
Lesson
Markets often move toward areas where many stop-loss orders are placed.
Understanding liquidity ladders can help traders:
• recognize repeated stop runs
• avoid placing stops at obvious levels
• watch how price reacts after liquidity is taken
Sometimes the final sweep leads to a strong move in the opposite direction.
Sentinel Principle
You do not trade every pattern.
You trade aligned conditions.
🛡 Discipline > Impulse
#XAUUSD
#Gold
#PriceAction
#LiquidityLadder
#LiquiditySweep
#MarketStructure
#TradingEducation
#TradingForBeginners
#TechnicalAnalysis
#SentinelLite
#IntradayTrading
#TradingJourney
XAUUSD | M15 | Sentinel Lite
Situation
In the previous chart we talked about liquidity sweeps, where price briefly moves past a level and then reverses.
Looking more closely at the chart, we can see that these sweeps did not happen randomly.
Instead, price moved step by step, taking liquidity at different levels.
This type of movement is often called a liquidity ladder.
What Is a Liquidity Ladder?
A liquidity ladder happens when the market takes liquidity several times in a row.
Each step usually includes:
• price moving past a previous high or low
• stop-loss orders being triggered
• price reacting in the opposite direction
This creates a step-by-step pattern, like a ladder.
Looking at the Chart
On this chart we can see:
• a first liquidity sweep below a previous low
• another sweep below the next level
• a final deeper sweep before price moved strongly upward
This shows how the market can take liquidity step by step before making a strong move.
Lesson
Markets often move toward areas where many stop-loss orders are placed.
Understanding liquidity ladders can help traders:
• recognize repeated stop runs
• avoid placing stops at obvious levels
• watch how price reacts after liquidity is taken
Sometimes the final sweep leads to a strong move in the opposite direction.
Sentinel Principle
You do not trade every pattern.
You trade aligned conditions.
🛡 Discipline > Impulse
#XAUUSD
#Gold
#PriceAction
#LiquidityLadder
#LiquiditySweep
#MarketStructure
#TradingEducation
#TradingForBeginners
#TechnicalAnalysis
#SentinelLite
#IntradayTrading
#TradingJourney

— Pips0mnian | Precision over prediction
Powiązane publikacje
Wyłączenie odpowiedzialności
Informacje i publikacje nie stanowią i nie powinny być traktowane jako porady finansowe, inwestycyjne, tradingowe ani jakiekolwiek inne rekomendacje dostarczane lub zatwierdzone przez TradingView. Więcej informacji znajduje się w Warunkach użytkowania.
— Pips0mnian | Precision over prediction
Powiązane publikacje
Wyłączenie odpowiedzialności
Informacje i publikacje nie stanowią i nie powinny być traktowane jako porady finansowe, inwestycyjne, tradingowe ani jakiekolwiek inne rekomendacje dostarczane lub zatwierdzone przez TradingView. Więcej informacji znajduje się w Warunkach użytkowania.