
🔍 Market Context
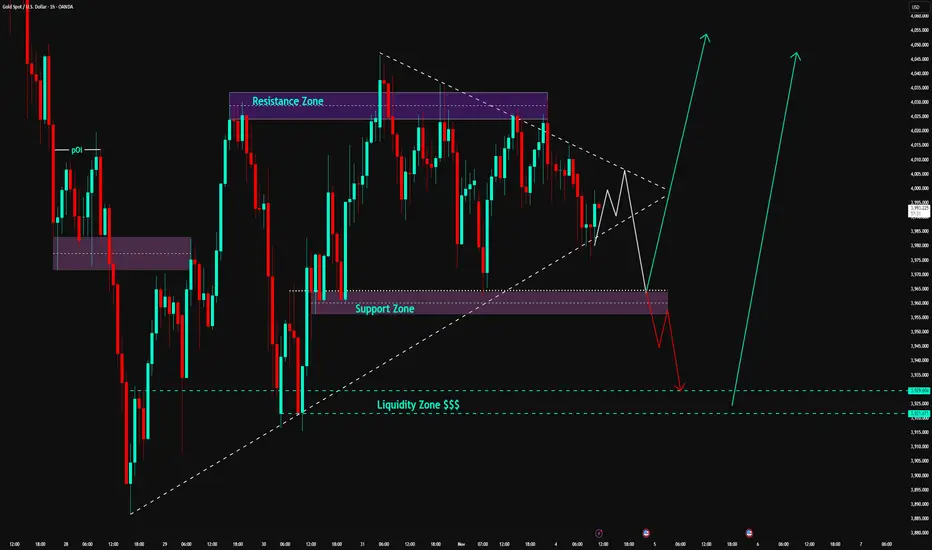
Gold is oscillating within a symmetrical triangle pattern, reflecting price compression and waiting for a breakout signal.
Buyers still maintain a short-term bullish structure, but the series of lower highs indicates increasing selling pressure.
The 3,959–3,964 USD zone is currently the “balance point” — if this area is breached, the downtrend could extend to the lower liquidity zone around 3,929–3,921 USD.
💎 Key Technical Zones
• Resistance Zone: 4,020 – 4,040 USD → the main resistance area of the triangle, where strong reactions are likely.
• Support Zone: 3,959 – 3,964 USD → the support area maintaining the bullish structure.
• Liquidity Zone: 3,929 – 3,921 USD → low liquidity area, potential to attract price stop sweeps before reversing.
🎯 Trading Scenarios
1️⃣ BUY Setup – Prioritize when price holds above support
• Entry: 3,959 – 3,964 USD
• Stop Loss: 3,940 USD
• Take Profit:
– TP1: 3,985
– TP2: 4,020
– TP3: 4,040
– TP4: 4,096
✳️ “Buy the discount” – Buy at the trendline convergence support area when confirmation signals appear (rejection or bullish ChoCH).
2️⃣ SELL Setup – Scenario if support breaks
• Entry: 3,950 – 3,955 USD (after candle closes below support zone)
• Stop Loss: 3,970 USD
• Take Profit:
– TP1: 3,935
– TP2: 3,925
– TP3: 3,912
✳️ “Sell the breakdown” – Sell when support is clearly breached, targeting the lowest liquidity zone (3,921 USD).
💬 Summary
Gold is in a phase of accumulation before major volatility.
If it holds above the 3,952 USD zone → prioritize BUY following the bullish structure.
If it breaks below 3,952 USD → SELL following the breakout towards the Liquidity Zone.
The scenario will be clearly confirmed when the current symmetrical triangle is broken.
💡 Today's Tagline:
“Liquidity defines direction — follow where the money hides.”
⏰ Timeframe: 1H
📅 Updated: 11/04/2025
✍️ Analysis by: Captain Vincent
Gold is oscillating within a symmetrical triangle pattern, reflecting price compression and waiting for a breakout signal.
Buyers still maintain a short-term bullish structure, but the series of lower highs indicates increasing selling pressure.
The 3,959–3,964 USD zone is currently the “balance point” — if this area is breached, the downtrend could extend to the lower liquidity zone around 3,929–3,921 USD.
💎 Key Technical Zones
• Resistance Zone: 4,020 – 4,040 USD → the main resistance area of the triangle, where strong reactions are likely.
• Support Zone: 3,959 – 3,964 USD → the support area maintaining the bullish structure.
• Liquidity Zone: 3,929 – 3,921 USD → low liquidity area, potential to attract price stop sweeps before reversing.
🎯 Trading Scenarios
1️⃣ BUY Setup – Prioritize when price holds above support
• Entry: 3,959 – 3,964 USD
• Stop Loss: 3,940 USD
• Take Profit:
– TP1: 3,985
– TP2: 4,020
– TP3: 4,040
– TP4: 4,096
✳️ “Buy the discount” – Buy at the trendline convergence support area when confirmation signals appear (rejection or bullish ChoCH).
2️⃣ SELL Setup – Scenario if support breaks
• Entry: 3,950 – 3,955 USD (after candle closes below support zone)
• Stop Loss: 3,970 USD
• Take Profit:
– TP1: 3,935
– TP2: 3,925
– TP3: 3,912
✳️ “Sell the breakdown” – Sell when support is clearly breached, targeting the lowest liquidity zone (3,921 USD).
💬 Summary
Gold is in a phase of accumulation before major volatility.
If it holds above the 3,952 USD zone → prioritize BUY following the bullish structure.
If it breaks below 3,952 USD → SELL following the breakout towards the Liquidity Zone.
The scenario will be clearly confirmed when the current symmetrical triangle is broken.
💡 Today's Tagline:
“Liquidity defines direction — follow where the money hides.”
⏰ Timeframe: 1H
📅 Updated: 11/04/2025
✍️ Analysis by: Captain Vincent
Zlecenie aktywne
GOLD MARKET ANALYSIS (XAU/USD) - STRATEGY UPDATEAssessment of Developments:
XAU/USD reacted strongly at the Support Zone, marking the first growth phase with an increase of 400 pips.
During the second test, at the 3964 level, the price initially surged with a 100 pips profit (M5 frame). However, strong selling pressure decisively broke through this Support Zone.
After the breakout, Gold retested the 3955 level (now Resistance) and continued to decline by an additional 270 pips profit.
Current Strategy:
Currently, Gold is showing a positive reaction at the Liquidity Zone.
I expect a recovery phase. To manage risk safely, traders should:
1. Execute Partial Profit-Taking at the Buy Liquidity zone.
2. Set Break-Even (SET BE) for the remaining position.
3. Consider closing the entire position if the profit target has been achieved.
Call to Action:
Follow and join my TradingView channel for the fastest and most accurate trend signal updates.
By Captain Vincent
Transakcja zamknięta: osiągnięto wyznaczony cel
GOLD ANALYSIS UPDATE (XAU/USD) - STRATEGY AT FVG
Assessment of Developments:
After hitting the Liquidity Zone, Gold (XAU/USD) recorded an impressive rebound, yielding a profit of approximately 460 pips.
The price then returned to test this liquidity zone. However, the Buying Power completely overwhelmed the sellers, indicating a strong rejection of the downtrend.
Current Strategy:
Currently, Gold is aiming to fill the Fair Value Gap (FVG) within the range of 3978 - 3983 on the H1 timeframe.
This is the potential target for the current growth phase.
Trading Recommendations:
Traders who entered a Long position at the previous Liquidity Zone should consider taking partial or full profit when the price approaches the FVG area of 3978 - 3983 on the H1 timeframe.
Follow and join my Tradingview channel for the fastest and most accurate trend signal updates.
By Captain Vincent

Wyłączenie odpowiedzialności
Informacje i publikacje nie stanowią i nie powinny być traktowane jako porady finansowe, inwestycyjne, tradingowe ani jakiekolwiek inne rekomendacje dostarczane lub zatwierdzone przez TradingView. Więcej informacji znajduje się w Warunkach użytkowania.
Wyłączenie odpowiedzialności
Informacje i publikacje nie stanowią i nie powinny być traktowane jako porady finansowe, inwestycyjne, tradingowe ani jakiekolwiek inne rekomendacje dostarczane lub zatwierdzone przez TradingView. Więcej informacji znajduje się w Warunkach użytkowania.