
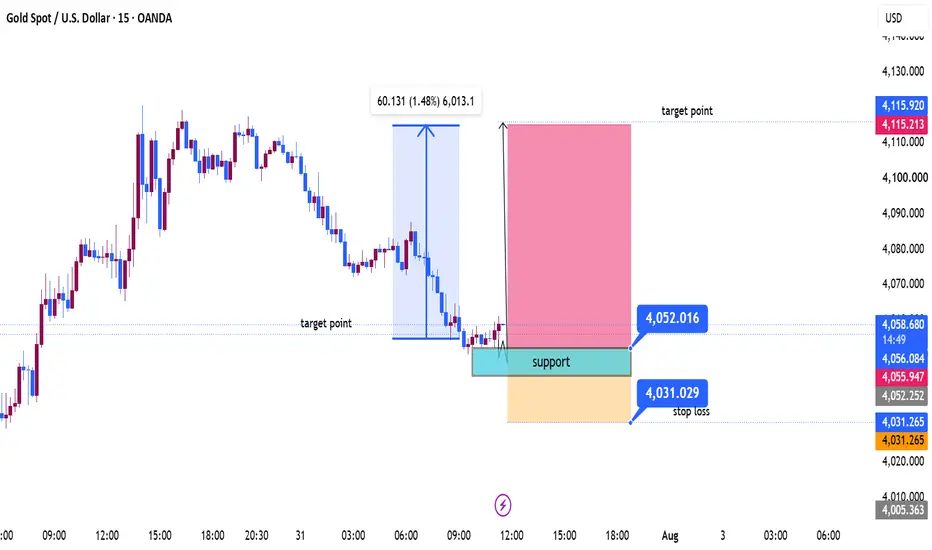
XAU/USD (Gold) 15-Minute Technical Analysis
The chart shows a strong bearish impulse followed by a period of consolidation at a key demand/support zone. Your marked long setup is based on a potential bullish reversal after liquidity is taken below recent lows.
Market Structure
The overall short-term trend remains bearish, with lower highs and lower lows.
Selling momentum has slowed as price enters the highlighted support area around 4052.0–4044.0.
Buyers are beginning to defend this zone, suggesting possible accumulation.
Liquidity Analysis
Sell-side liquidity has likely been swept below the recent intraday lows.
The sharp decline appears to have completed a liquidity grab before price stabilized.
If buyers reclaim nearby resistance, trapped sellers could fuel a quick upside move.
Support Zone
Primary Support: 4052.0–4044.0
This area has produced multiple reactions, making it an important demand zone.
As long as price remains above this support, the bullish setup remains valid.
Resistance Levels
First Resistance: 4060–4063
Second Resistance: 4078–4082
Major Target: 4115 (your projected take-profit level)
A break above 4063 would increase the probability of a stronger recovery toward the higher resistance levels.
Trade Setup Review
Entry: Around 4052
Stop Loss: 4031
Target: 4115
Risk-to-Reward: Approximately 1:3, which is favorable if the support holds.
Bullish Confirmation
Look for:
Strong bullish engulfing candles.
Higher lows forming on the 15-minute timeframe.
Increasing bullish volume.
A breakout above 4060–4063 followed by a successful retest.
Bearish Invalidation
The bullish idea becomes weaker if:
Price closes decisively below 4052.
The 4031 stop-loss is broken.
Selling volume increases during the breakdown.
Outlook
The market is attempting to form a short-term bottom after an aggressive sell-off. The support zone around 4052 is the key level to watch. If buyers successfully defend this area and reclaim 4060, the probability of a recovery toward 4115 increases significantly. However, failure to hold support could trigger another bearish leg toward the 4030 region before any meaningful rebound occurs.
Bias: Cautiously Bullish above 4052, with confirmation required on a break above 4060.
The chart shows a strong bearish impulse followed by a period of consolidation at a key demand/support zone. Your marked long setup is based on a potential bullish reversal after liquidity is taken below recent lows.
Market Structure
The overall short-term trend remains bearish, with lower highs and lower lows.
Selling momentum has slowed as price enters the highlighted support area around 4052.0–4044.0.
Buyers are beginning to defend this zone, suggesting possible accumulation.
Liquidity Analysis
Sell-side liquidity has likely been swept below the recent intraday lows.
The sharp decline appears to have completed a liquidity grab before price stabilized.
If buyers reclaim nearby resistance, trapped sellers could fuel a quick upside move.
Support Zone
Primary Support: 4052.0–4044.0
This area has produced multiple reactions, making it an important demand zone.
As long as price remains above this support, the bullish setup remains valid.
Resistance Levels
First Resistance: 4060–4063
Second Resistance: 4078–4082
Major Target: 4115 (your projected take-profit level)
A break above 4063 would increase the probability of a stronger recovery toward the higher resistance levels.
Trade Setup Review
Entry: Around 4052
Stop Loss: 4031
Target: 4115
Risk-to-Reward: Approximately 1:3, which is favorable if the support holds.
Bullish Confirmation
Look for:
Strong bullish engulfing candles.
Higher lows forming on the 15-minute timeframe.
Increasing bullish volume.
A breakout above 4060–4063 followed by a successful retest.
Bearish Invalidation
The bullish idea becomes weaker if:
Price closes decisively below 4052.
The 4031 stop-loss is broken.
Selling volume increases during the breakdown.
Outlook
The market is attempting to form a short-term bottom after an aggressive sell-off. The support zone around 4052 is the key level to watch. If buyers successfully defend this area and reclaim 4060, the probability of a recovery toward 4115 increases significantly. However, failure to hold support could trigger another bearish leg toward the 4030 region before any meaningful rebound occurs.
Bias: Cautiously Bullish above 4052, with confirmation required on a break above 4060.

join my telegram channel t.me/goldsignalicthttps://t.me/goldsignalicthttps://t.me/goldsignalict
Wyłączenie odpowiedzialności
Informacje i publikacje nie stanowią i nie powinny być traktowane jako porady finansowe, inwestycyjne, tradingowe ani jakiekolwiek inne rekomendacje dostarczane lub zatwierdzone przez TradingView. Więcej informacji znajduje się w Warunkach użytkowania.
join my telegram channel t.me/goldsignalicthttps://t.me/goldsignalicthttps://t.me/goldsignalict
Wyłączenie odpowiedzialności
Informacje i publikacje nie stanowią i nie powinny być traktowane jako porady finansowe, inwestycyjne, tradingowe ani jakiekolwiek inne rekomendacje dostarczane lub zatwierdzone przez TradingView. Więcej informacji znajduje się w Warunkach użytkowania.