
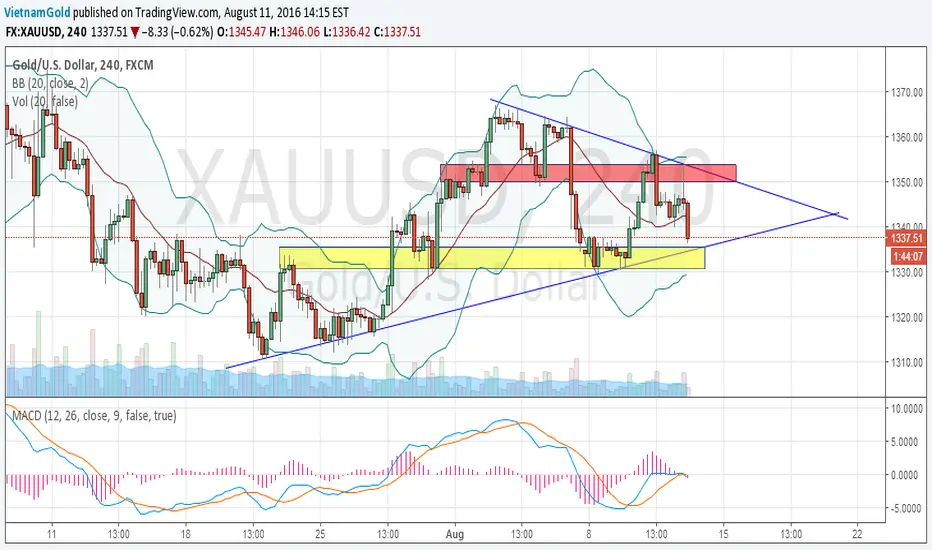
Gold has been in a range 1330-1360 for a couple of days. A triangle pattern can be drawn as chart. A break out of the triangle pattern will signal the next move for gold. Watch the support zone by the support trend line around 1330-1335. A break down of that support area will signal a big move down. Meanwhile, the resistance zone by the resistance trend line is around 1350-1355. A break out of that resistance area will signal a move up. Please note that a triangle pattern is usually a continuation pattern. Therefore I would prefer a move down here since gold is still in a correction phase.
Uwaga
Gold is behaving exactly as charted above, in a triangle pattern, gold found support at 1335 before turning back up to 1355. Again sellers came in a pushed it back to 1333-1335 level. The pattern is due to a break down possibly. This is how I count waves in a triangle pattern. Wave 5 is coming I guess so. And gold might break down to 1310-1320.Uwaga
Gold is still trading within market range, a break out of that triangle pattern is due. I am updating my waves count due to current market situation. Only a close above 1350 will confirm breaking out to the upside. 
Powiązane publikacje
Wyłączenie odpowiedzialności
Informacje i publikacje nie stanowią i nie powinny być traktowane jako porady finansowe, inwestycyjne, tradingowe ani jakiekolwiek inne rekomendacje dostarczane lub zatwierdzone przez TradingView. Więcej informacji znajduje się w Warunkach użytkowania.
Powiązane publikacje
Wyłączenie odpowiedzialności
Informacje i publikacje nie stanowią i nie powinny być traktowane jako porady finansowe, inwestycyjne, tradingowe ani jakiekolwiek inne rekomendacje dostarczane lub zatwierdzone przez TradingView. Więcej informacji znajduje się w Warunkach użytkowania.