
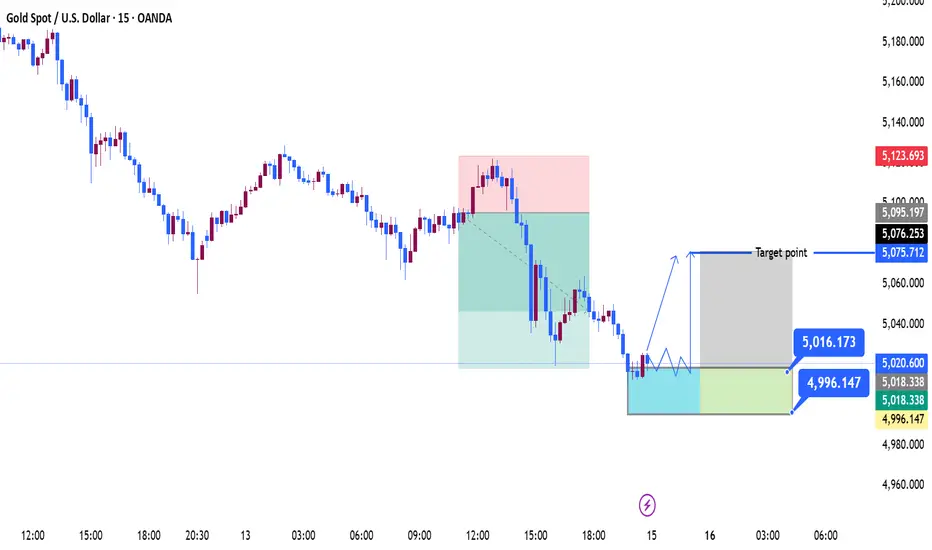
1️⃣ Current Market Structure
The market is clearly in a short-term downtrend.
Key signs:
Lower highs
Lower lows
Strong bearish impulse from the highlighted sell zone.
Price dropped from around 5095–5100 down to ~5016 and is now consolidating at support.
This type of pause usually leads to either accumulation for reversal or continuation breakdown.
2️⃣ Key Levels on Your Chart
🔵 Support Zone
4996 – 5016
This is the demand zone you marked.
4996.147 → major support
5016.173 → local resistance inside the range
If this holds → bounce likely.
🔴 Supply / Resistance
5075 – 5095
This area was the previous breakdown zone.
If price rallies:
sellers will likely defend here again.
3️⃣ Your Projected Scenario (Very Logical)
Your drawing shows:
1️⃣ Accumulation / sideways movement
2️⃣ Higher low formation
3️⃣ Break above 5016
4️⃣ Move to 5075 target
This is a classic liquidity sweep → reversal structure.
4️⃣ Bullish Scenario 📈
Conditions:
Price holds above 4996
Breaks 5016 resistance
Creates higher low
Then targets:
1️⃣ 5040
2️⃣ 5060
3️⃣ 5075 (your target zone)
This would be a ~60 point move.
5️⃣ Bearish Scenario 📉
If 4996 breaks strongly, then downside opens.
Next supports:
4975
4950
4920
Because the trend is still bearish, breakdown is also possible.
6️⃣ Smart Entry Idea (Based on Your Chart)
Possible buy setup:
Entry zone:
5000 – 5010
Stop loss:
below 4990
Targets:
5040
5060
5075
Risk-reward looks good if support holds.
7️⃣ Important Confirmation Signals
Watch for:
✅ Bullish engulfing candle
✅ Double bottom around 4996
✅ Break of minor trendline
✅ Strong volume push above 5016
Without these → market may continue falling.
✅ Overall probability right now:
Short-term bounce: 60%
Breakdown continuation: 40%
The market is clearly in a short-term downtrend.
Key signs:
Lower highs
Lower lows
Strong bearish impulse from the highlighted sell zone.
Price dropped from around 5095–5100 down to ~5016 and is now consolidating at support.
This type of pause usually leads to either accumulation for reversal or continuation breakdown.
2️⃣ Key Levels on Your Chart
🔵 Support Zone
4996 – 5016
This is the demand zone you marked.
4996.147 → major support
5016.173 → local resistance inside the range
If this holds → bounce likely.
🔴 Supply / Resistance
5075 – 5095
This area was the previous breakdown zone.
If price rallies:
sellers will likely defend here again.
3️⃣ Your Projected Scenario (Very Logical)
Your drawing shows:
1️⃣ Accumulation / sideways movement
2️⃣ Higher low formation
3️⃣ Break above 5016
4️⃣ Move to 5075 target
This is a classic liquidity sweep → reversal structure.
4️⃣ Bullish Scenario 📈
Conditions:
Price holds above 4996
Breaks 5016 resistance
Creates higher low
Then targets:
1️⃣ 5040
2️⃣ 5060
3️⃣ 5075 (your target zone)
This would be a ~60 point move.
5️⃣ Bearish Scenario 📉
If 4996 breaks strongly, then downside opens.
Next supports:
4975
4950
4920
Because the trend is still bearish, breakdown is also possible.
6️⃣ Smart Entry Idea (Based on Your Chart)
Possible buy setup:
Entry zone:
5000 – 5010
Stop loss:
below 4990
Targets:
5040
5060
5075
Risk-reward looks good if support holds.
7️⃣ Important Confirmation Signals
Watch for:
✅ Bullish engulfing candle
✅ Double bottom around 4996
✅ Break of minor trendline
✅ Strong volume push above 5016
Without these → market may continue falling.
✅ Overall probability right now:
Short-term bounce: 60%
Breakdown continuation: 40%

join my telegram channel t.me/goldsignalicthttps://t.me/goldsignalicthttps://t.me/goldsignalict
Wyłączenie odpowiedzialności
Informacje i publikacje nie stanowią i nie powinny być traktowane jako porady finansowe, inwestycyjne, tradingowe ani jakiekolwiek inne rekomendacje dostarczane lub zatwierdzone przez TradingView. Więcej informacji znajduje się w Warunkach użytkowania.
join my telegram channel t.me/goldsignalicthttps://t.me/goldsignalicthttps://t.me/goldsignalict
Wyłączenie odpowiedzialności
Informacje i publikacje nie stanowią i nie powinny być traktowane jako porady finansowe, inwestycyjne, tradingowe ani jakiekolwiek inne rekomendacje dostarczane lub zatwierdzone przez TradingView. Więcej informacji znajduje się w Warunkach użytkowania.